Gallery
Some examples of charts from the book.
Magnitudes
| Paired bar chart | Stacked bar chart |
|---|---|
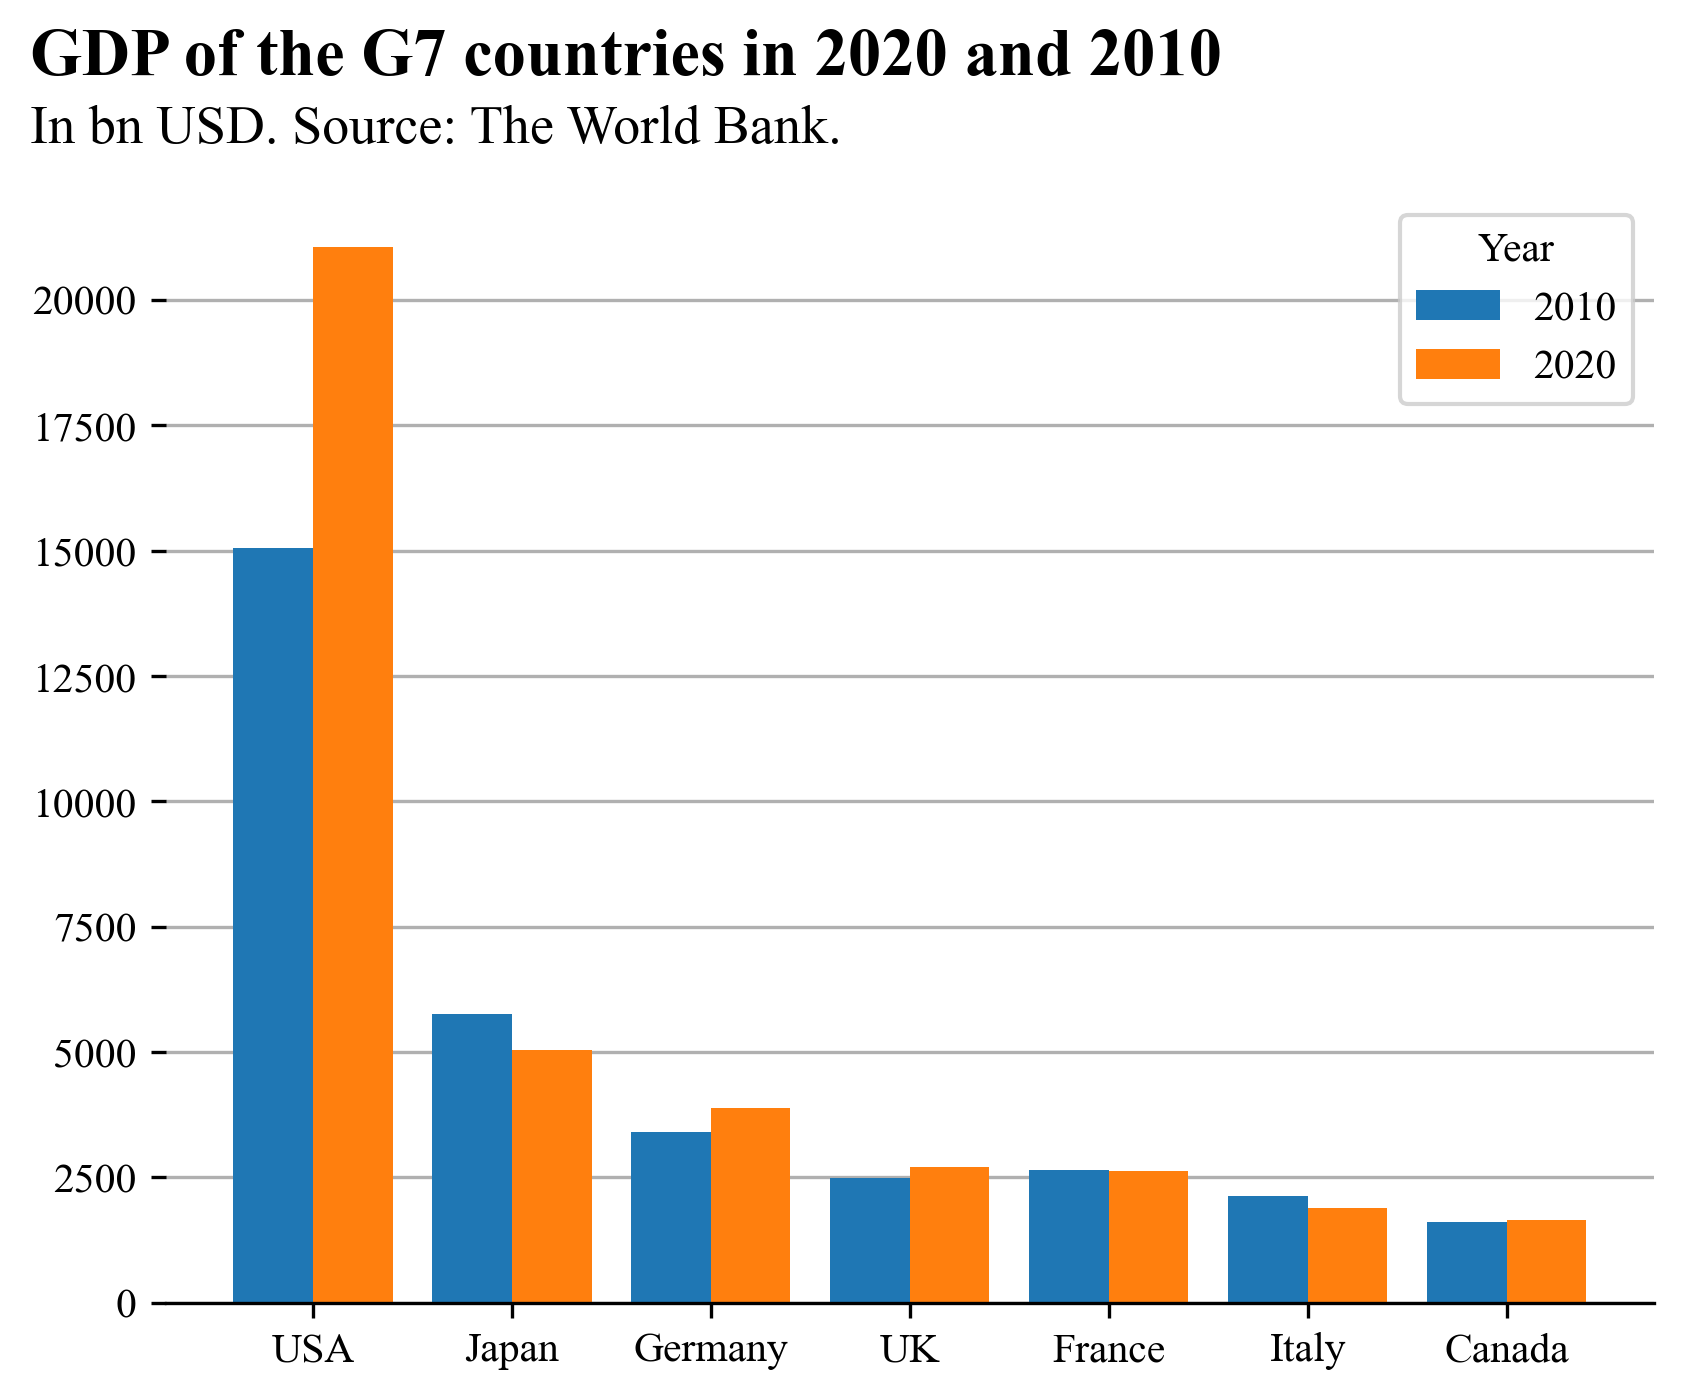 |
 |
Proportions
| Pie chart | Multiple waffle chart |
|---|---|
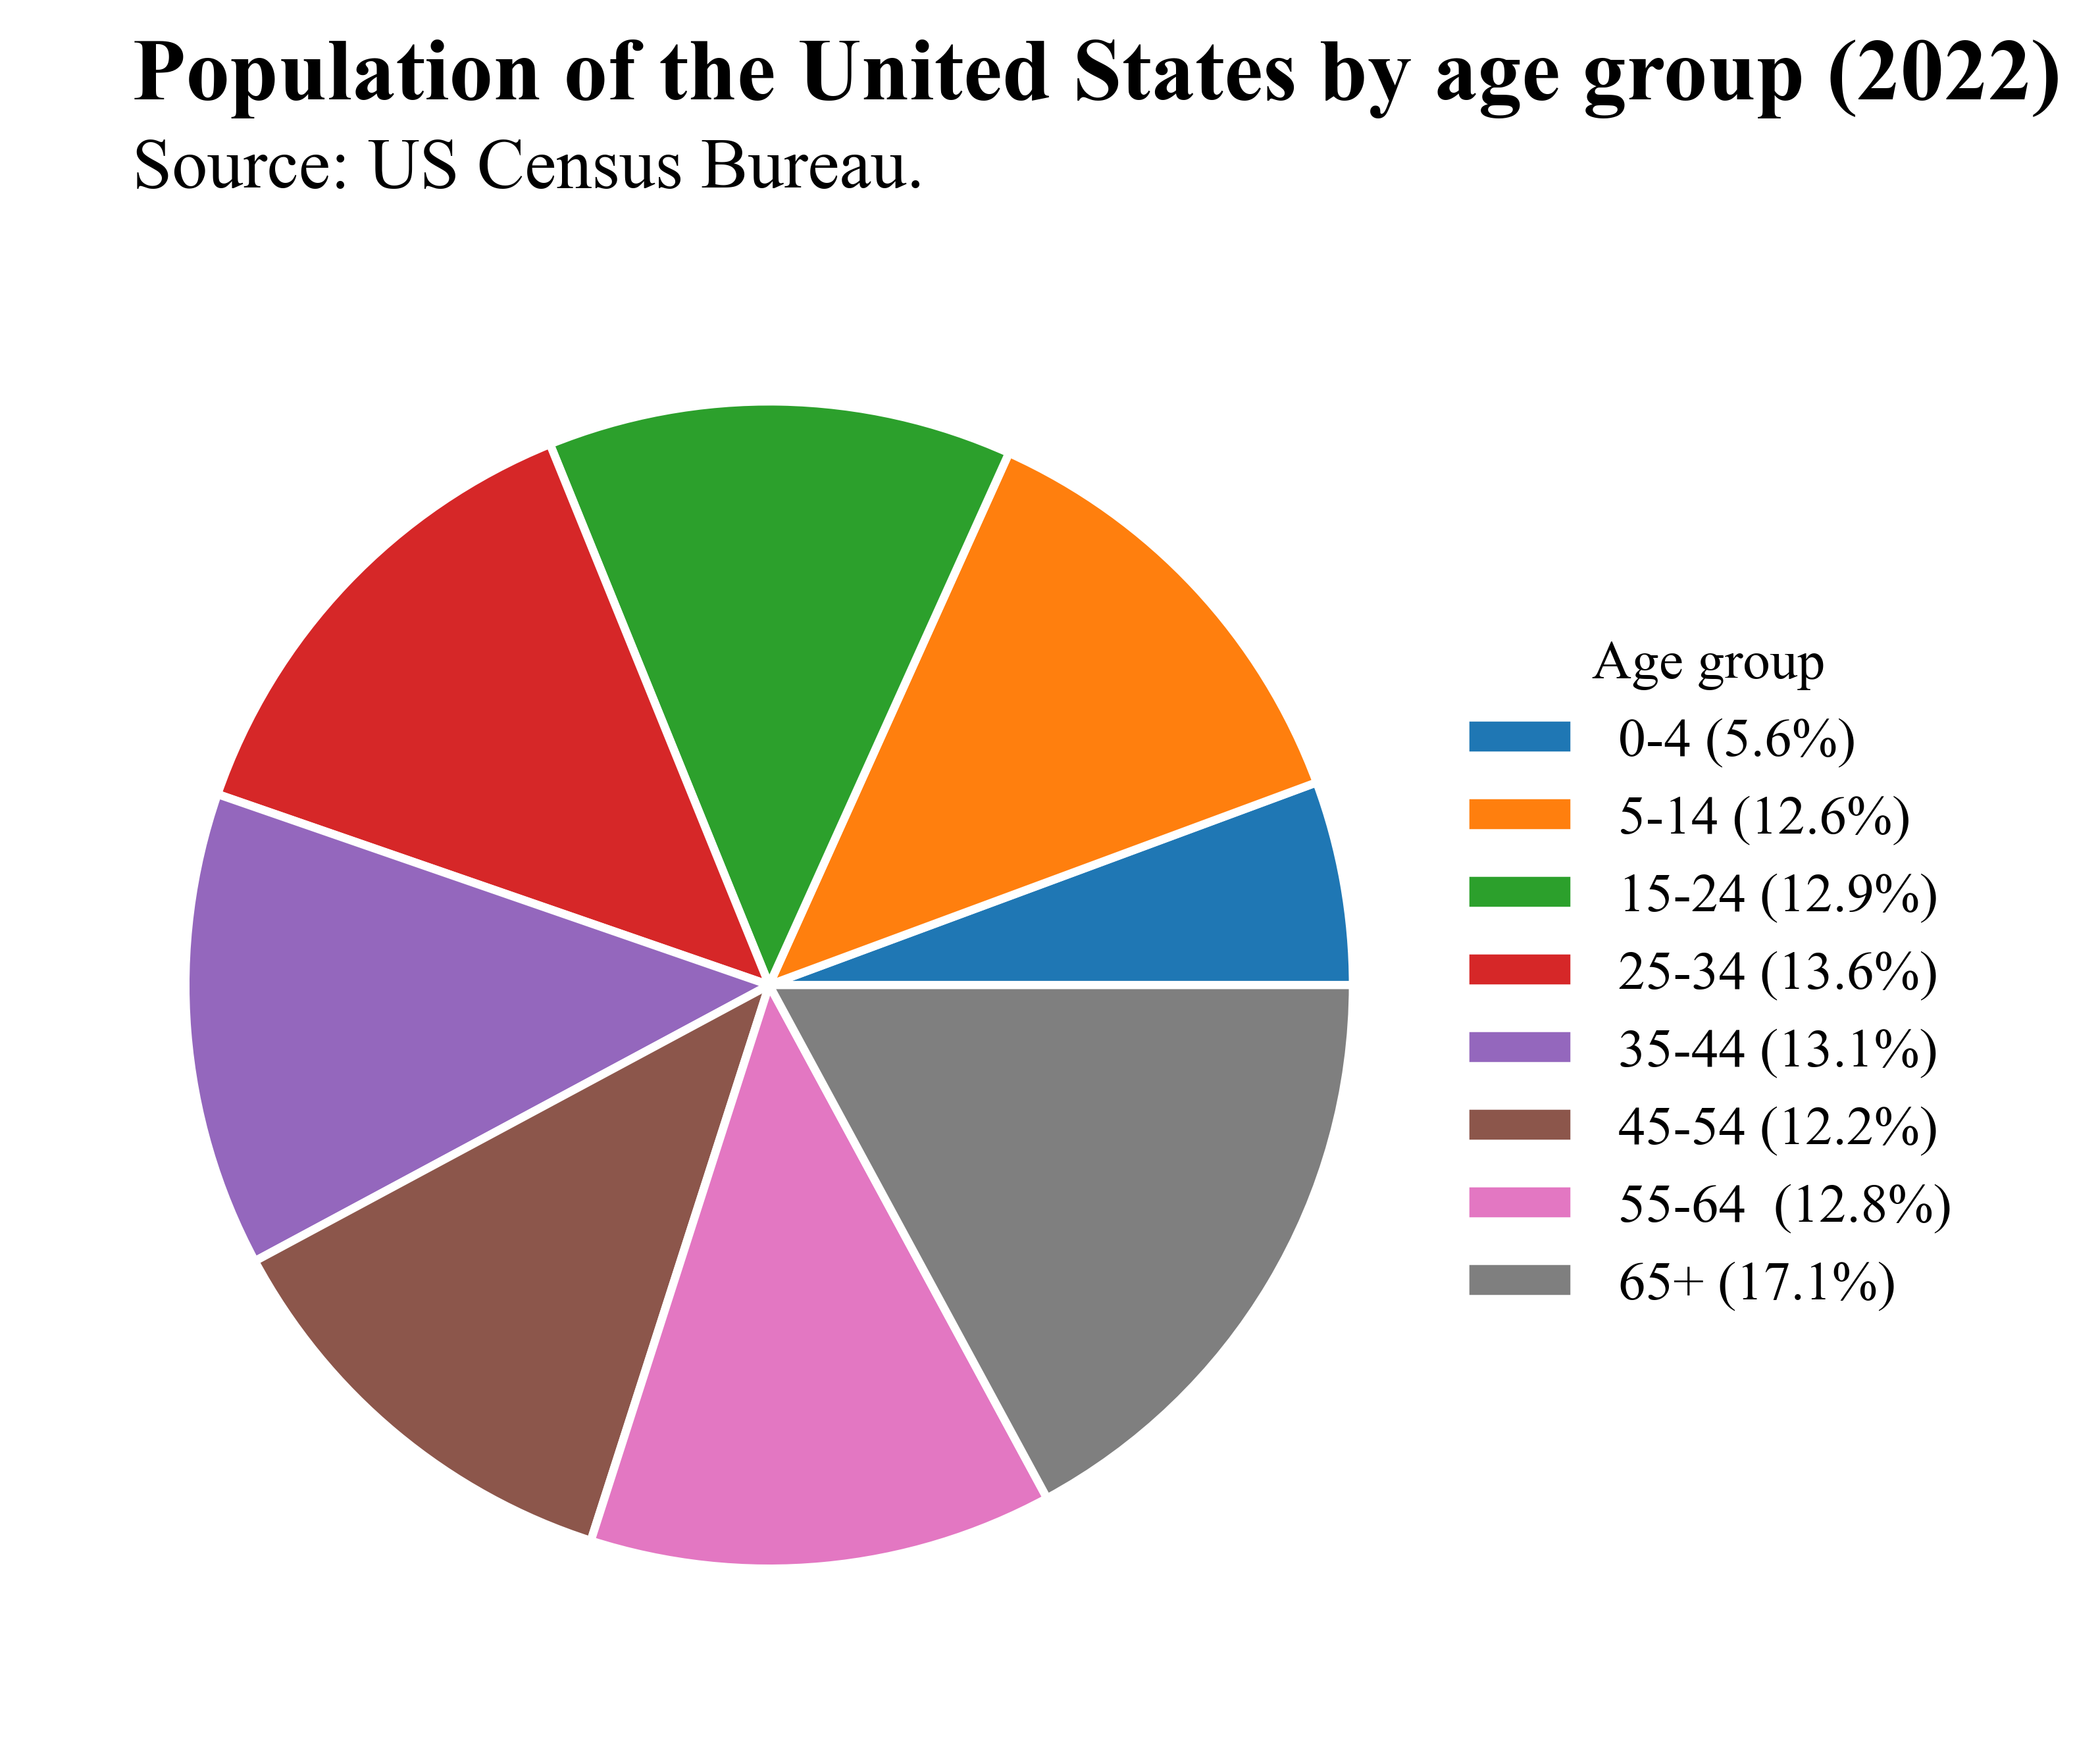 |
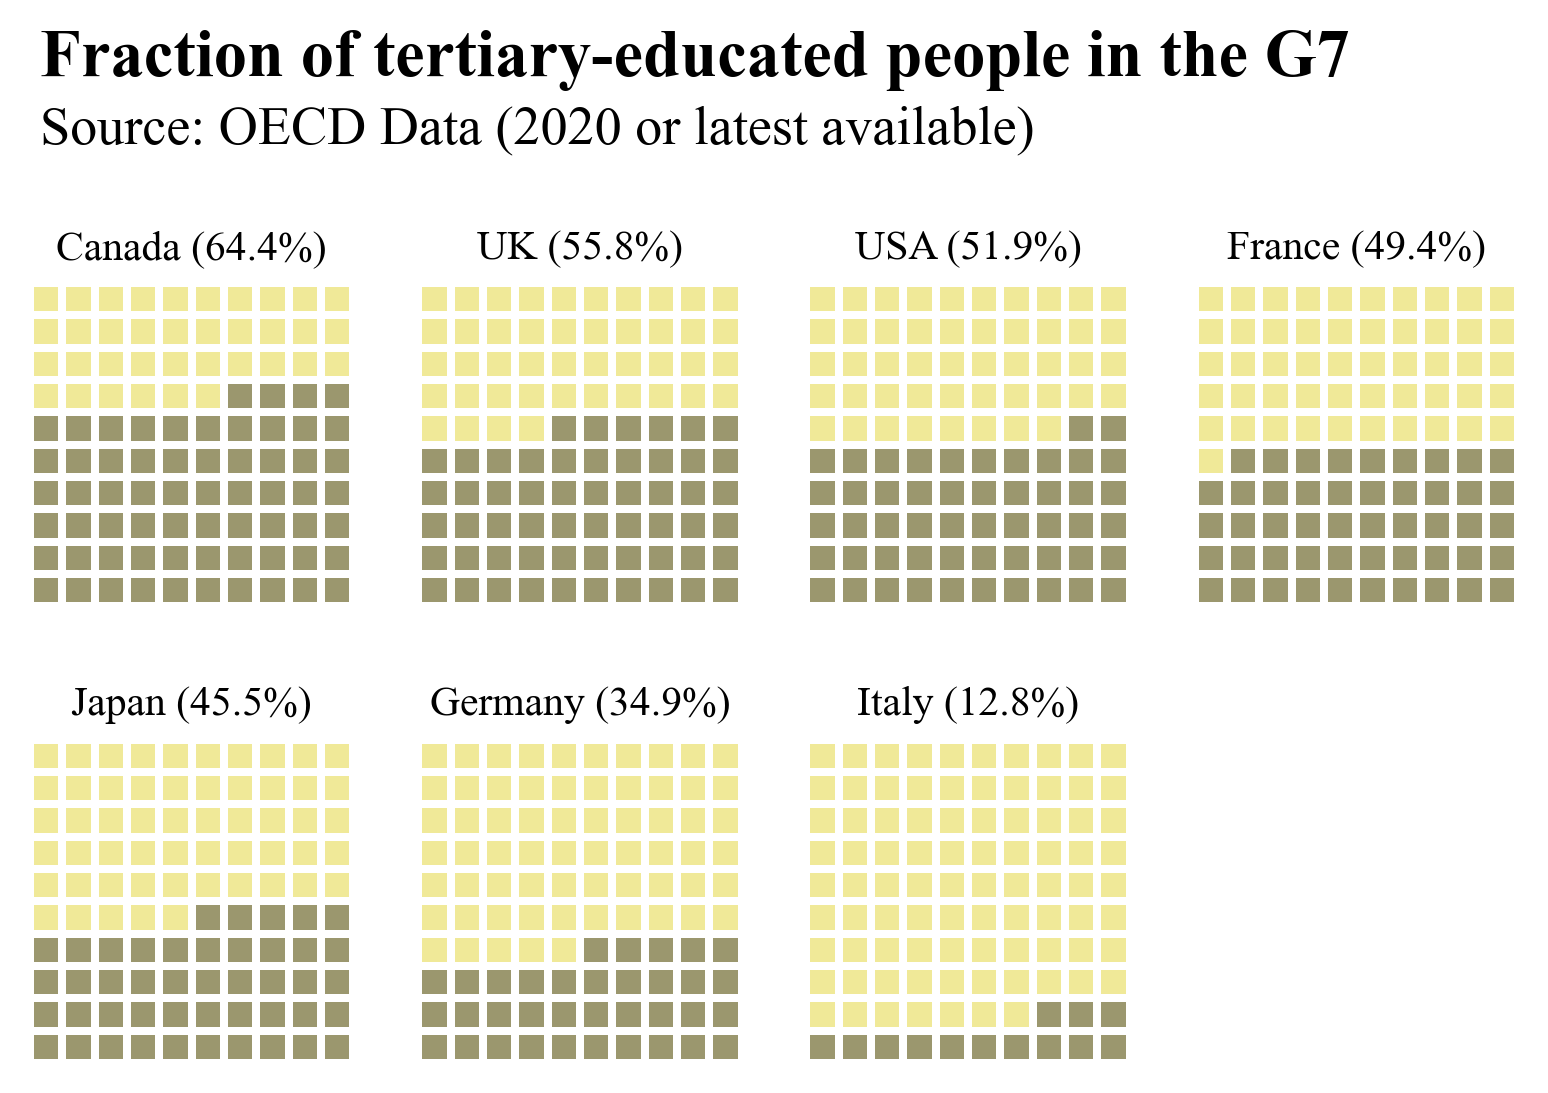 |
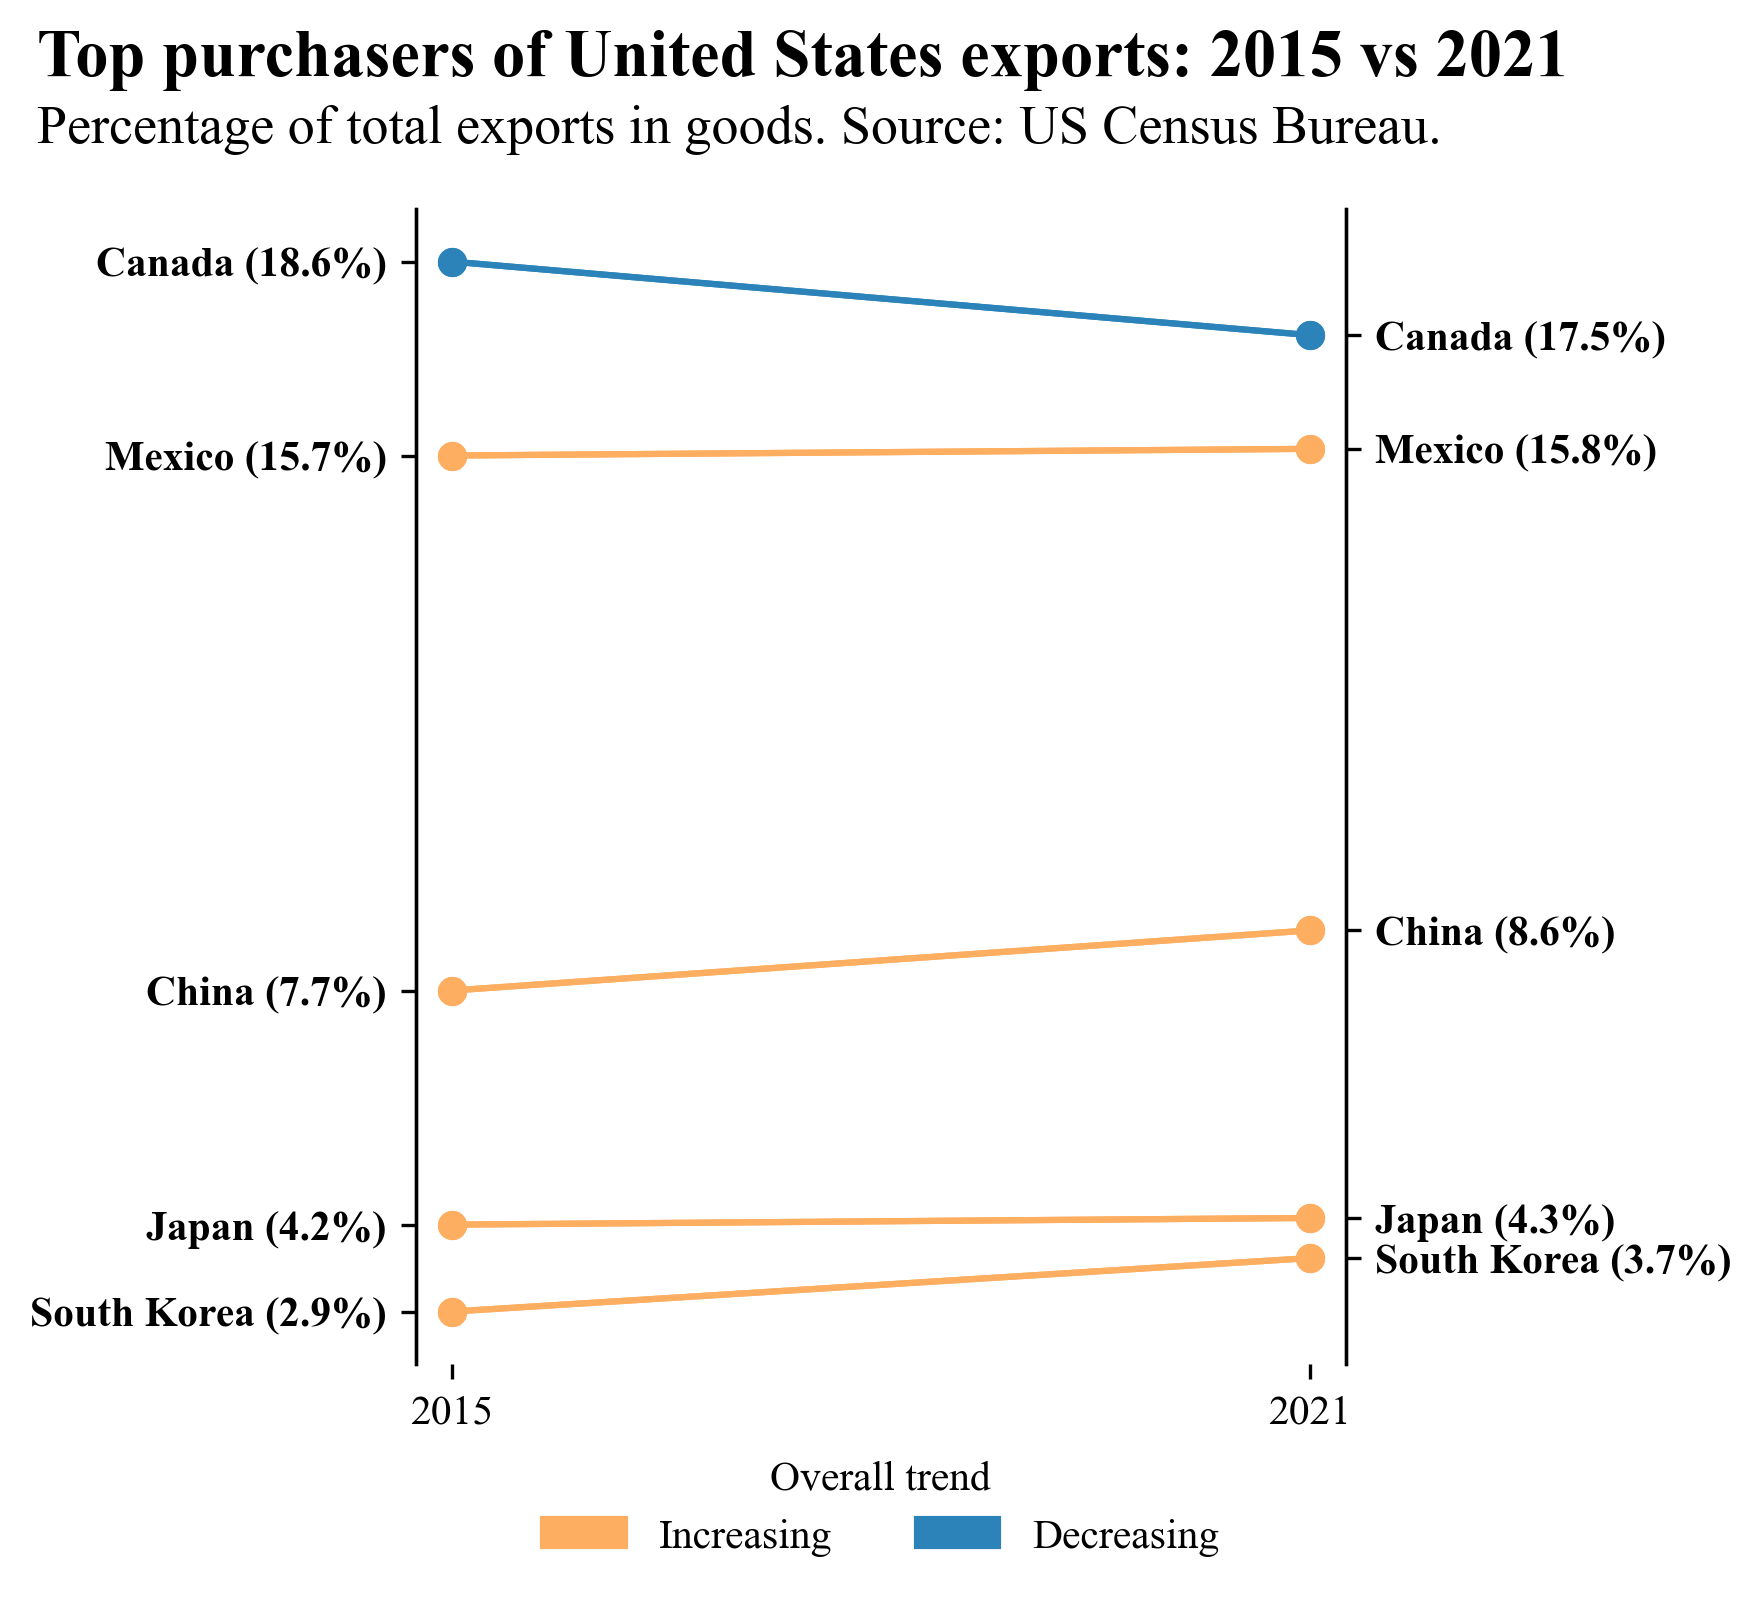
One variable as a function of the other
| Multi-line chart | Slope chart |
|---|---|
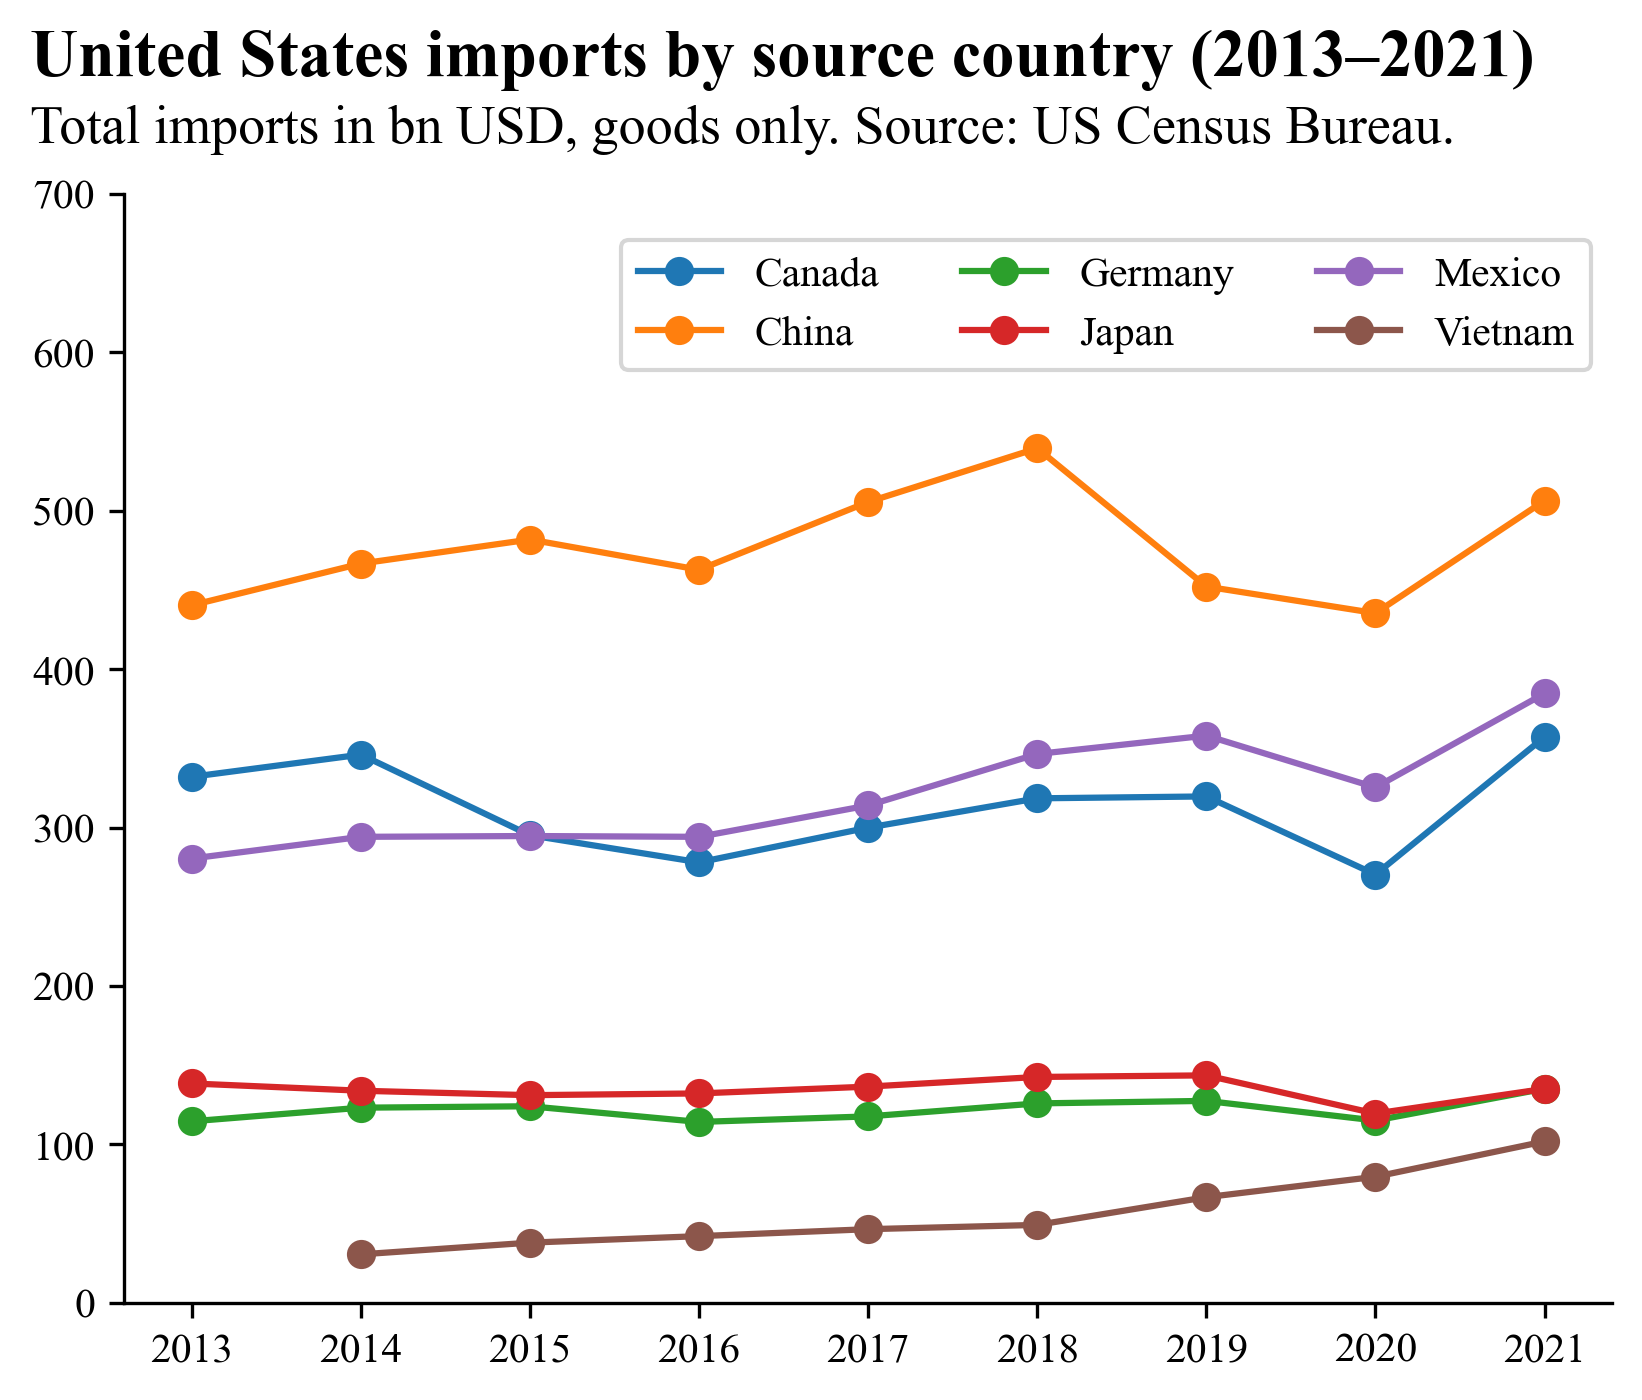 |
 |
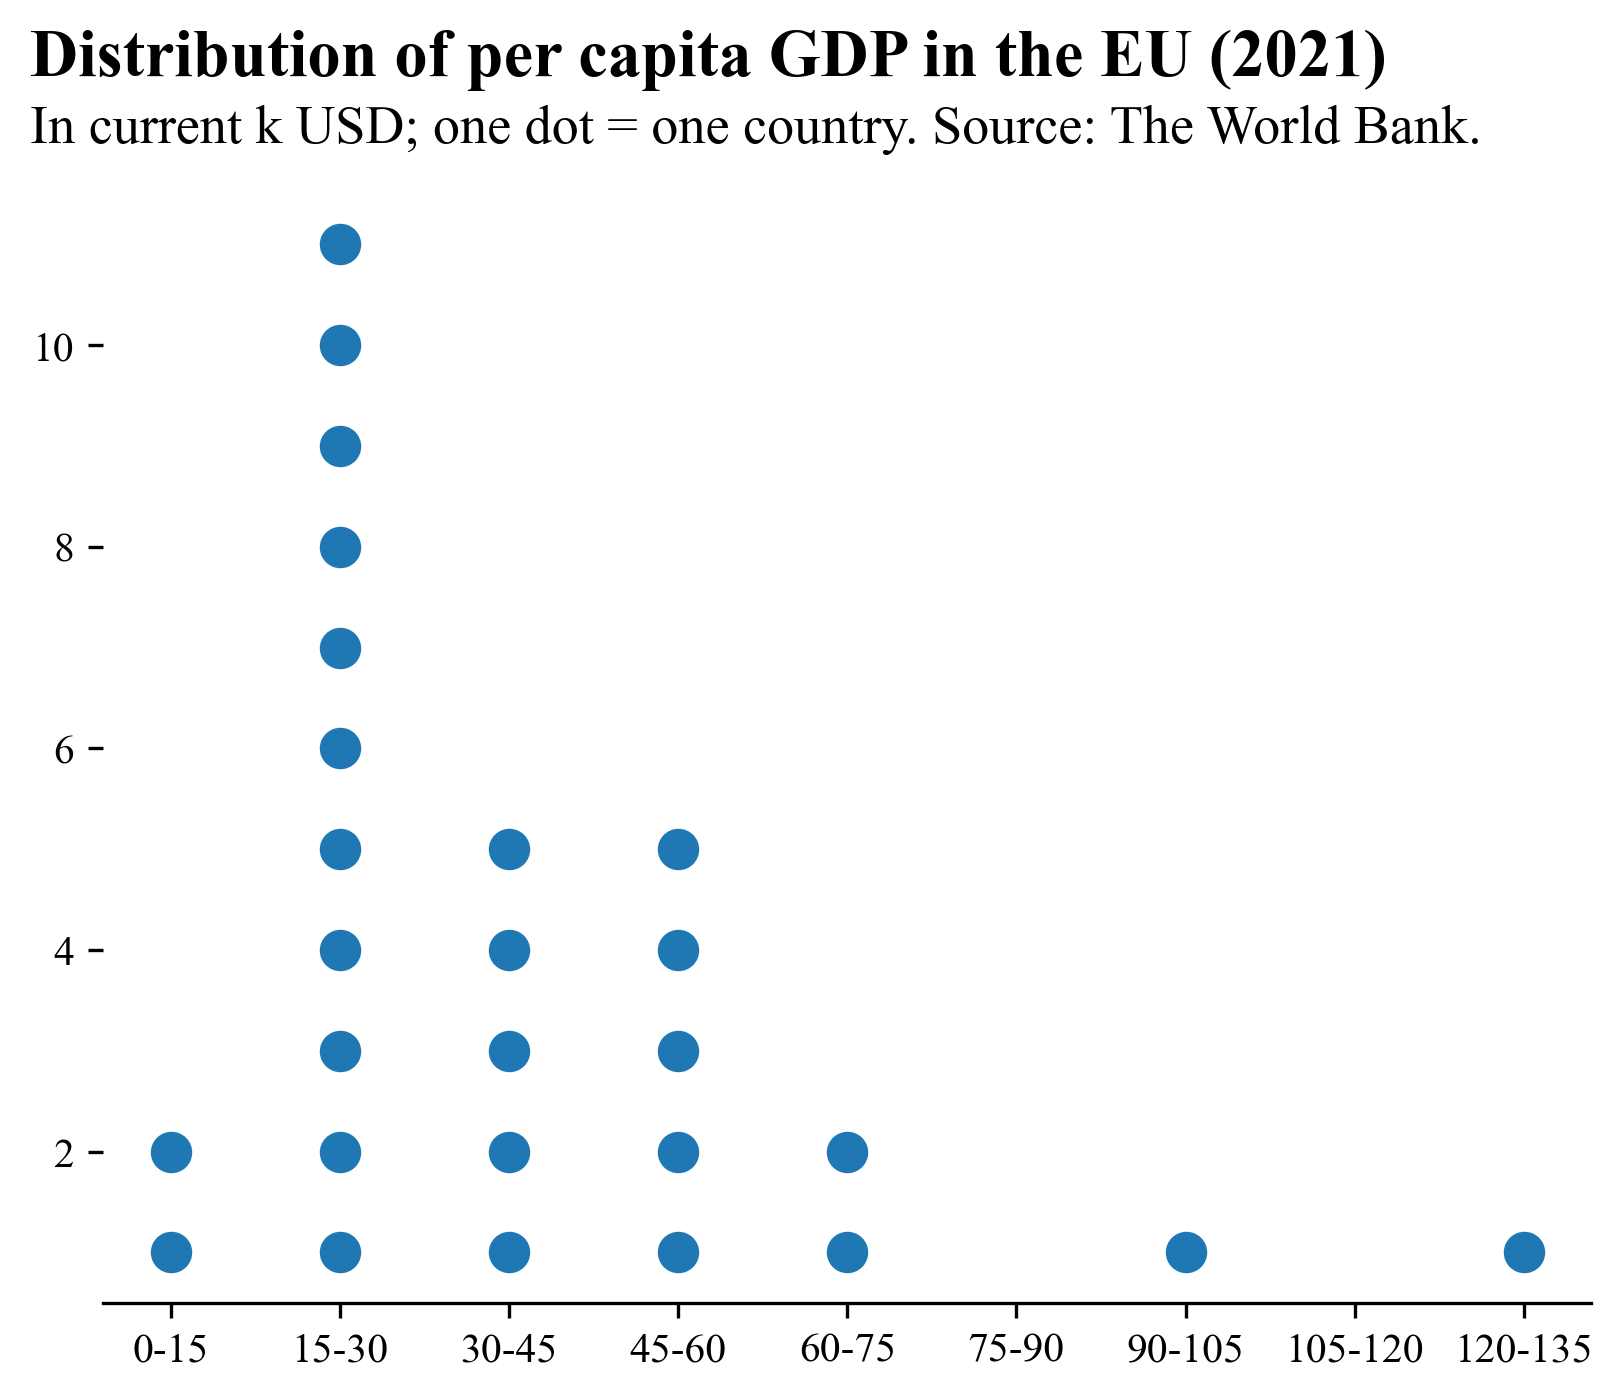
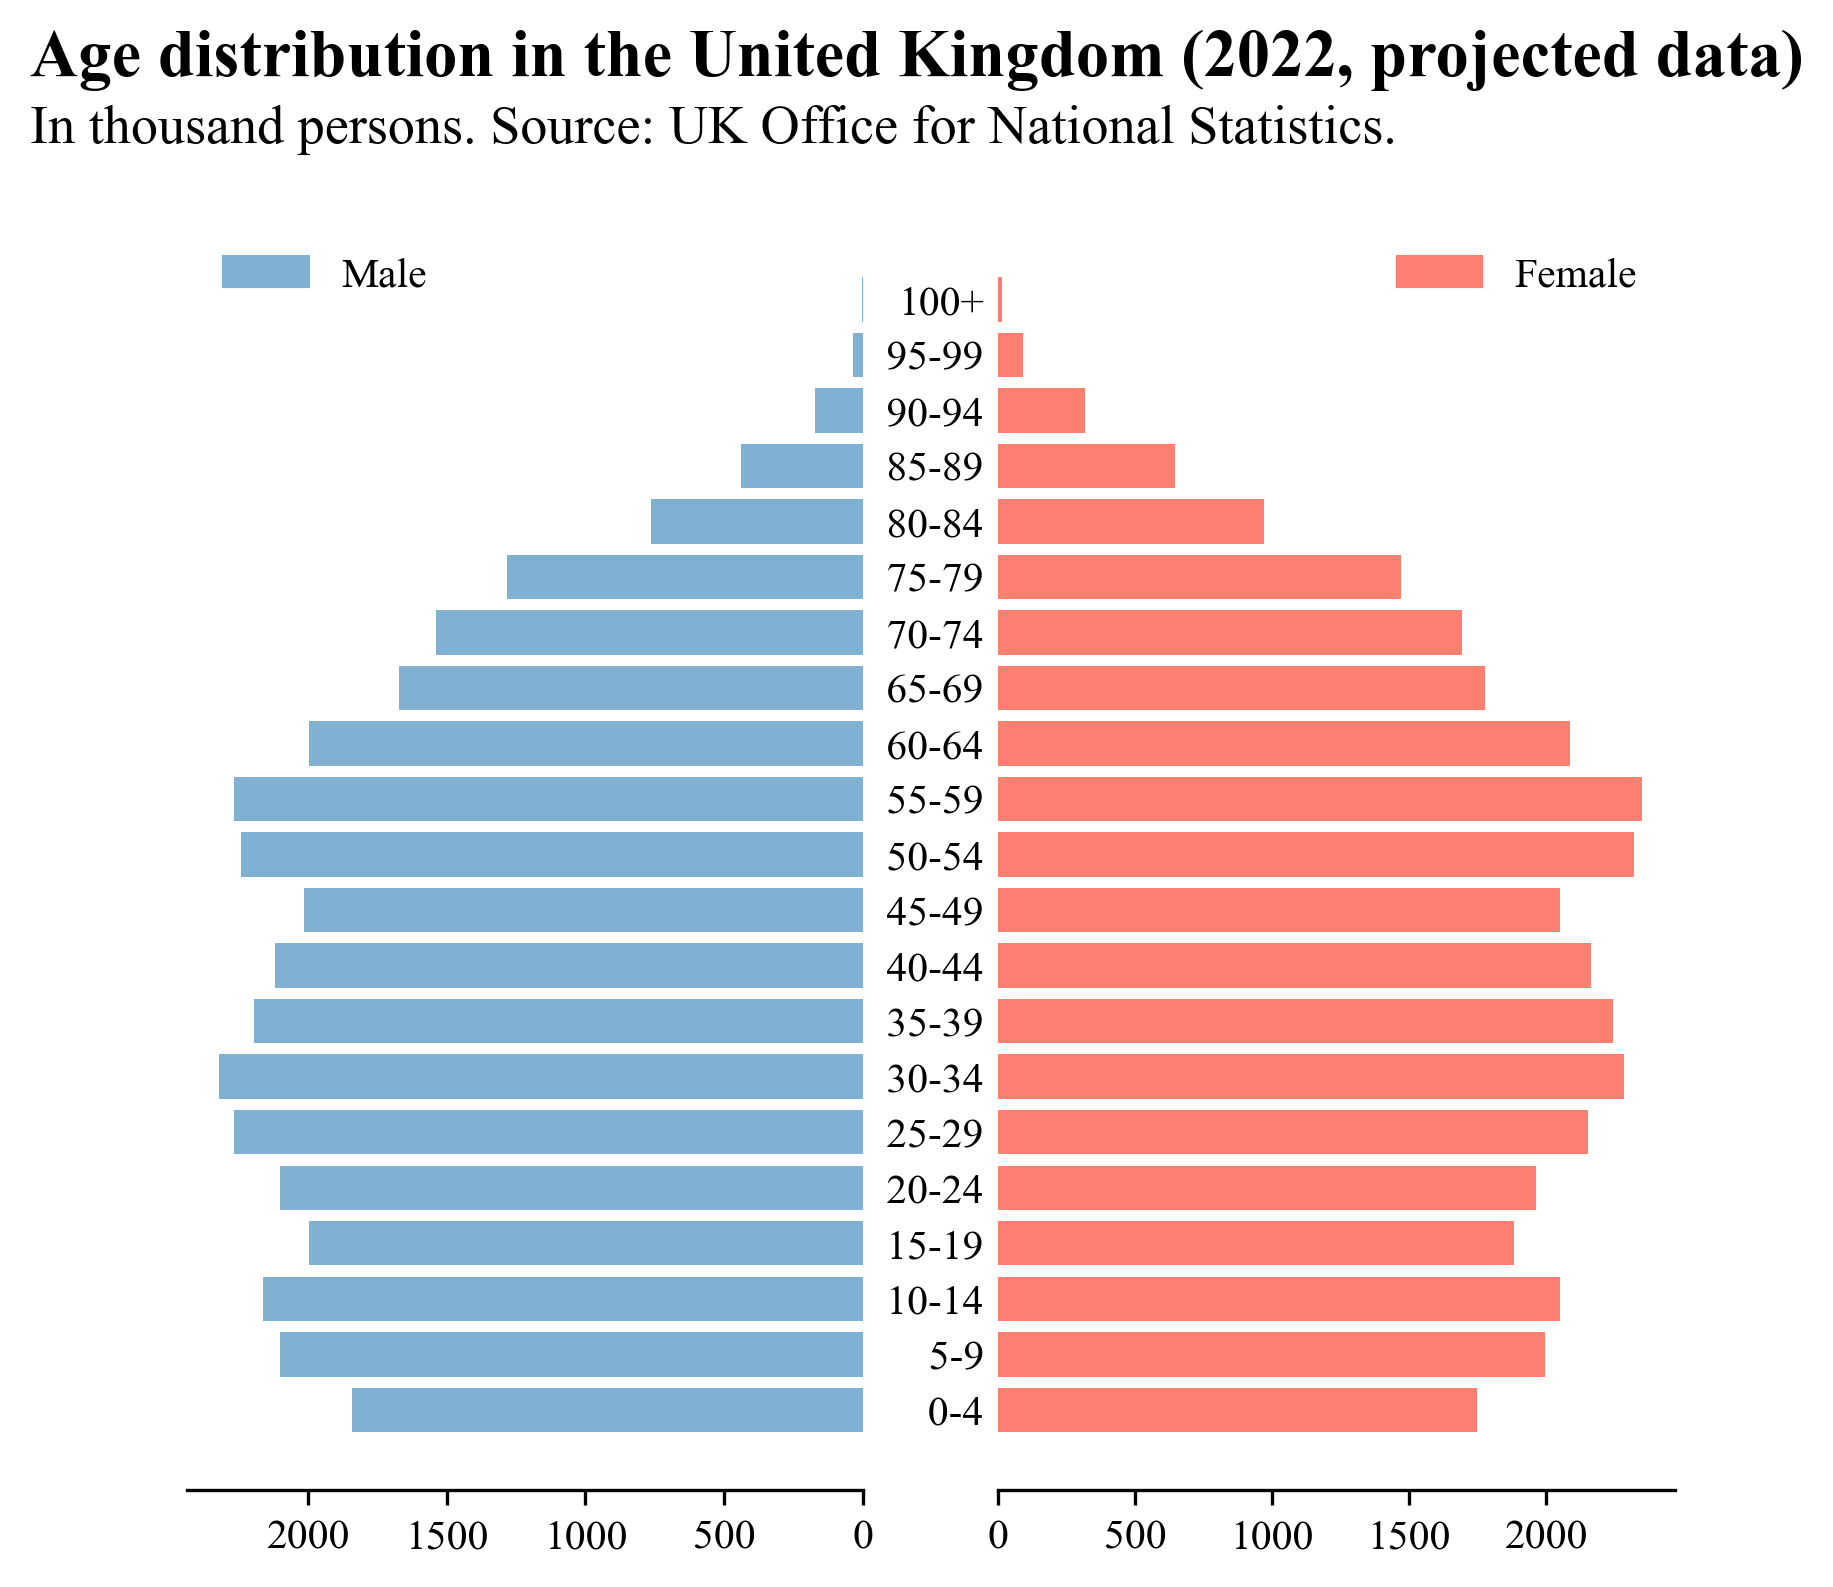
Frequency distributions
| Dot diagram | Pyramid plot |
|---|---|
 |
 |
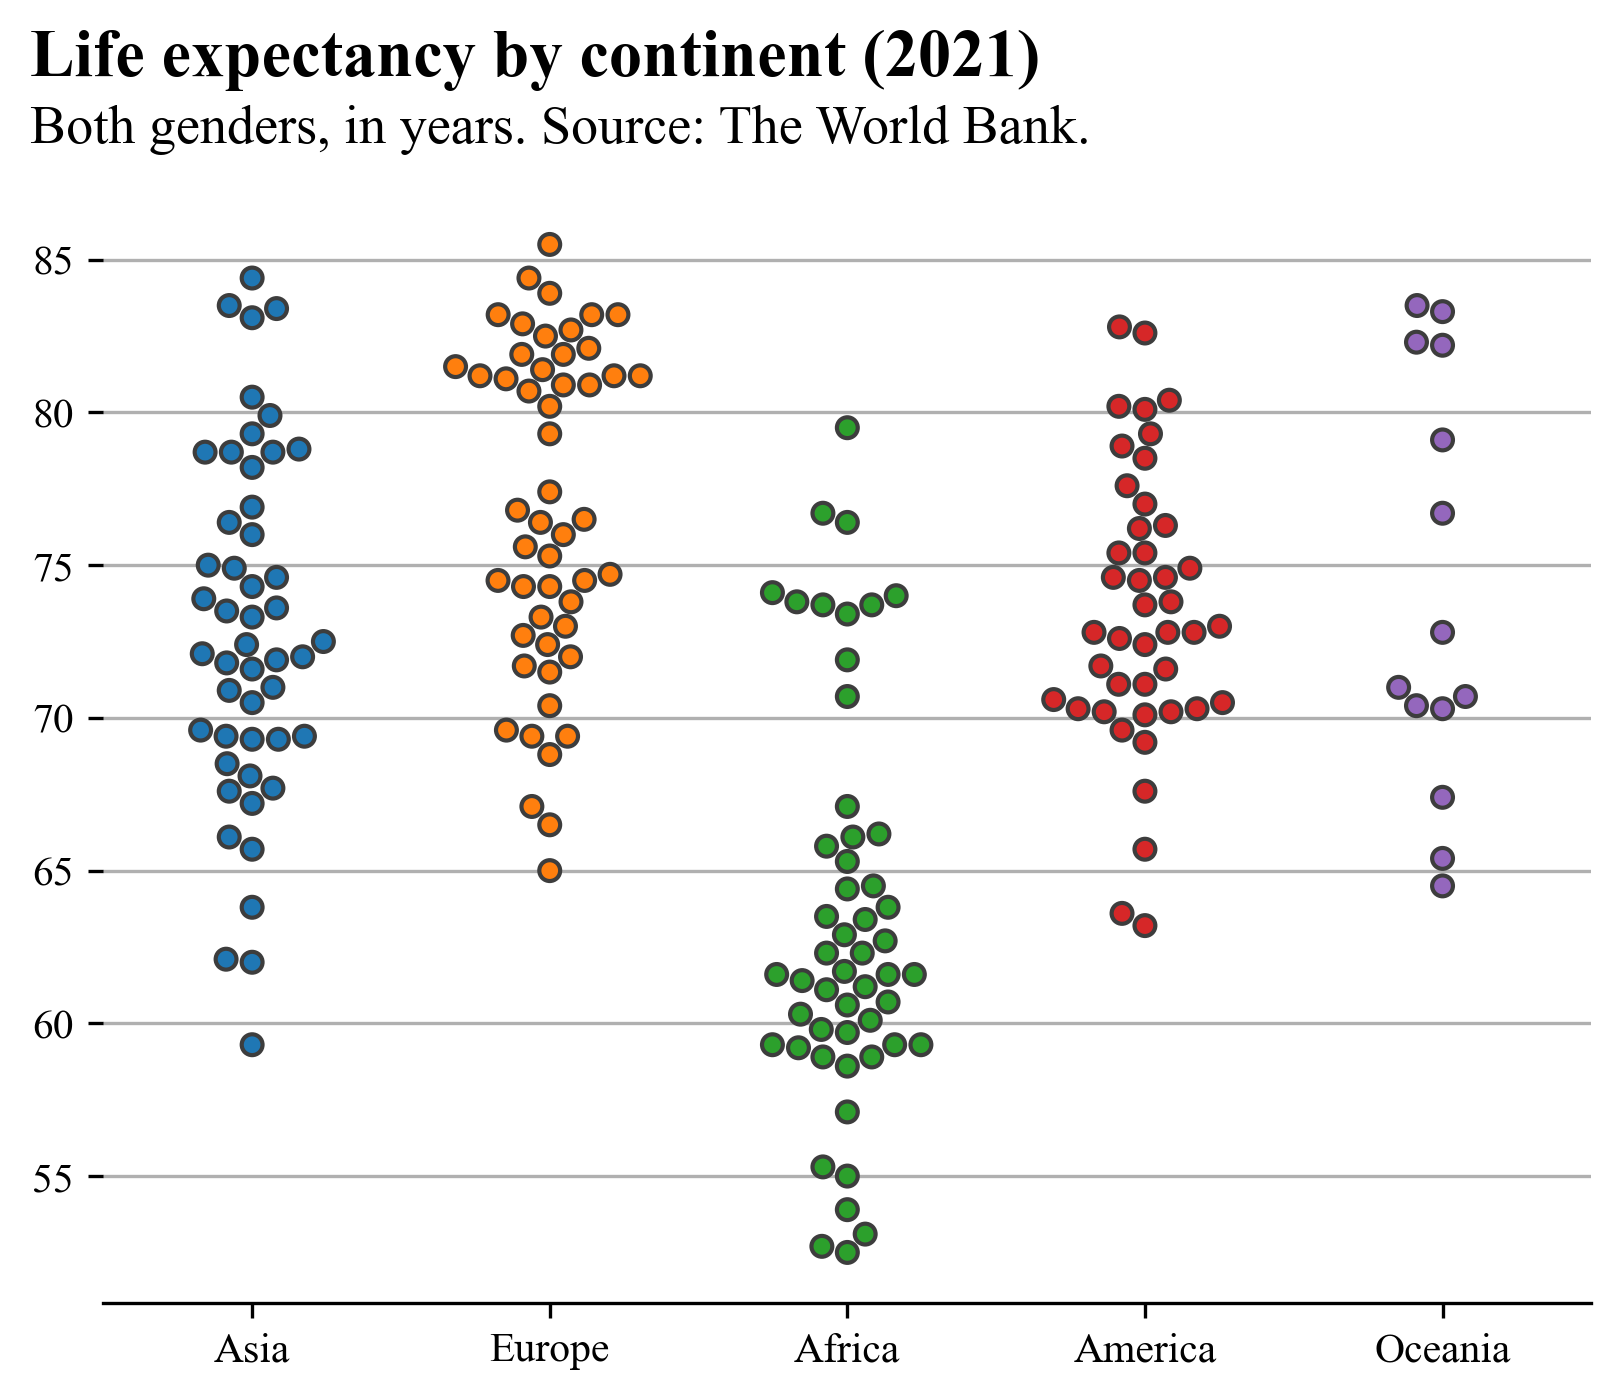
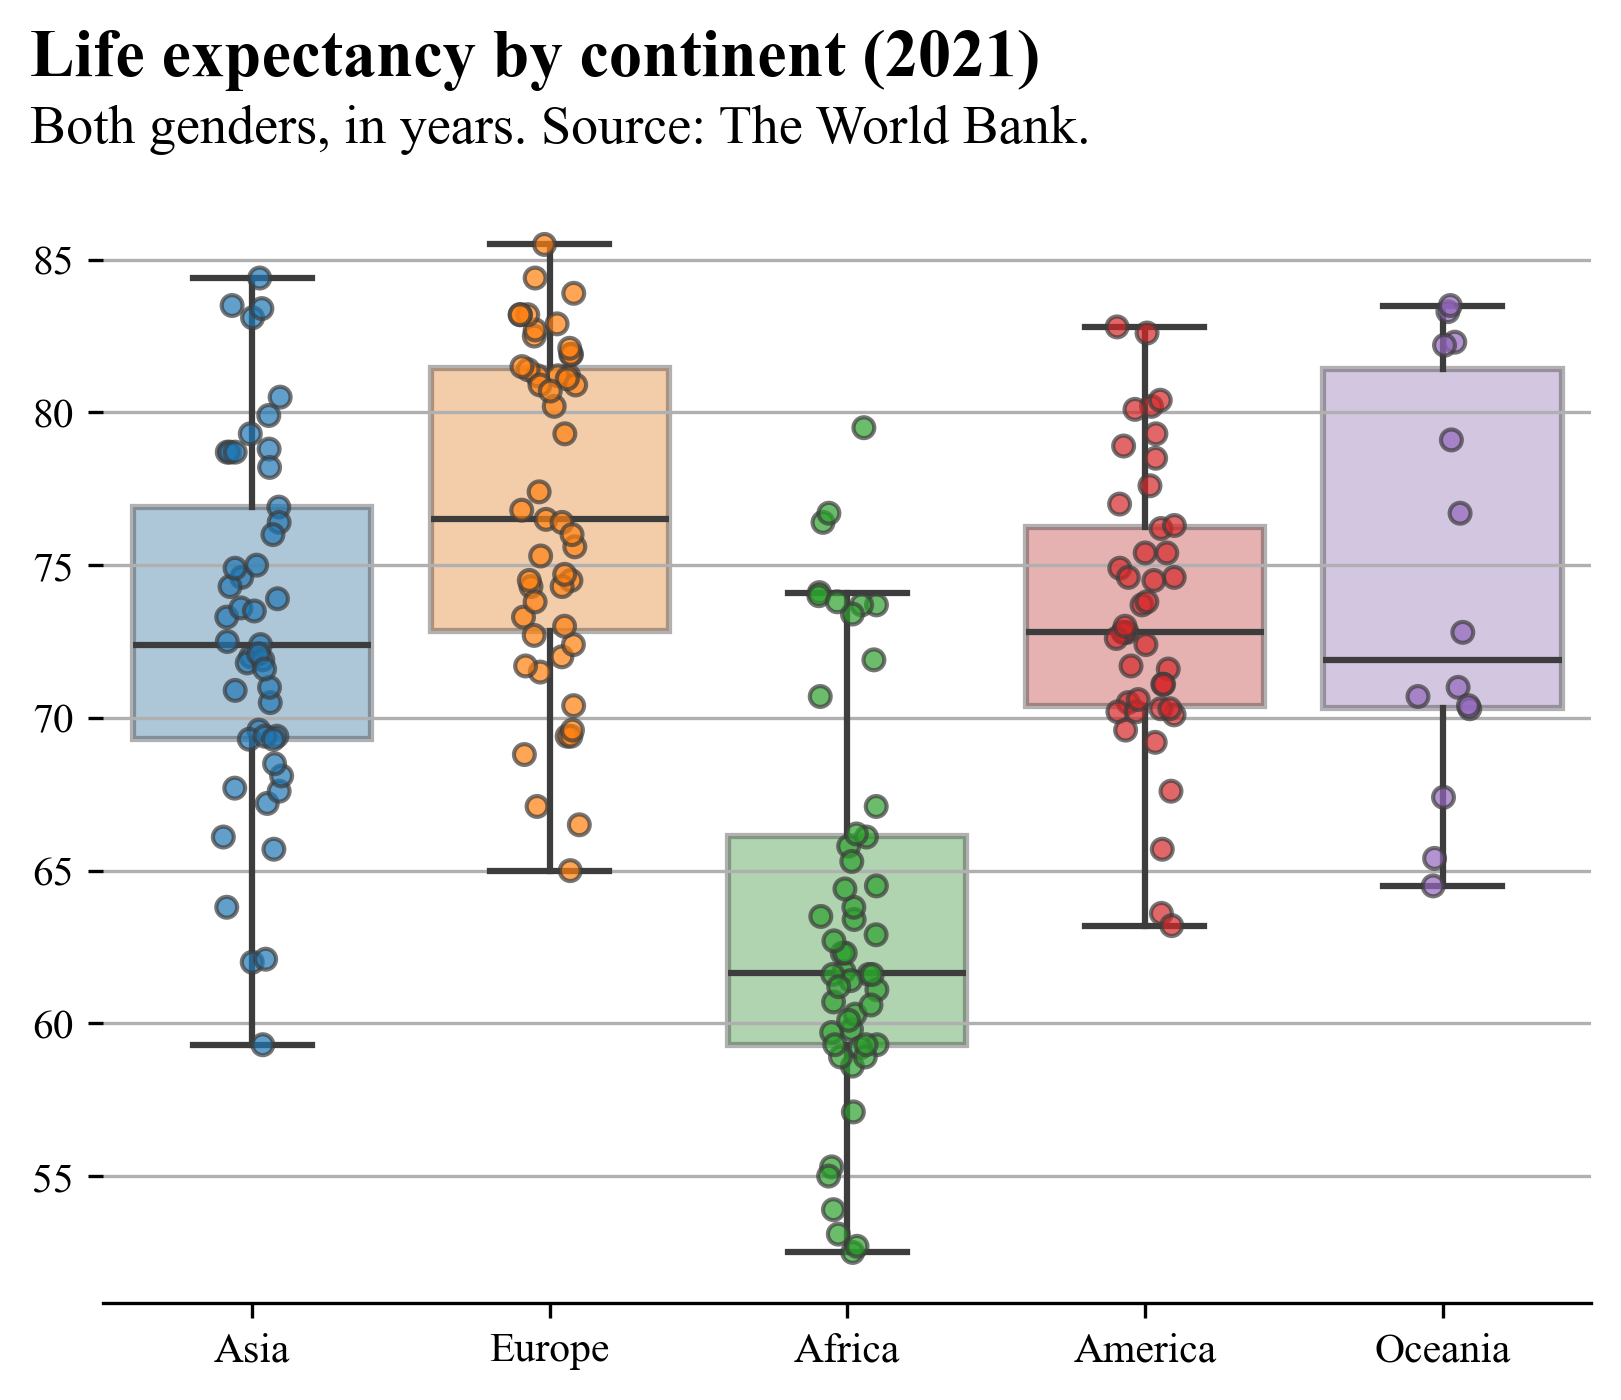
Groups
| Swarm plots | Box and strip plots |
|---|---|
 |
 |
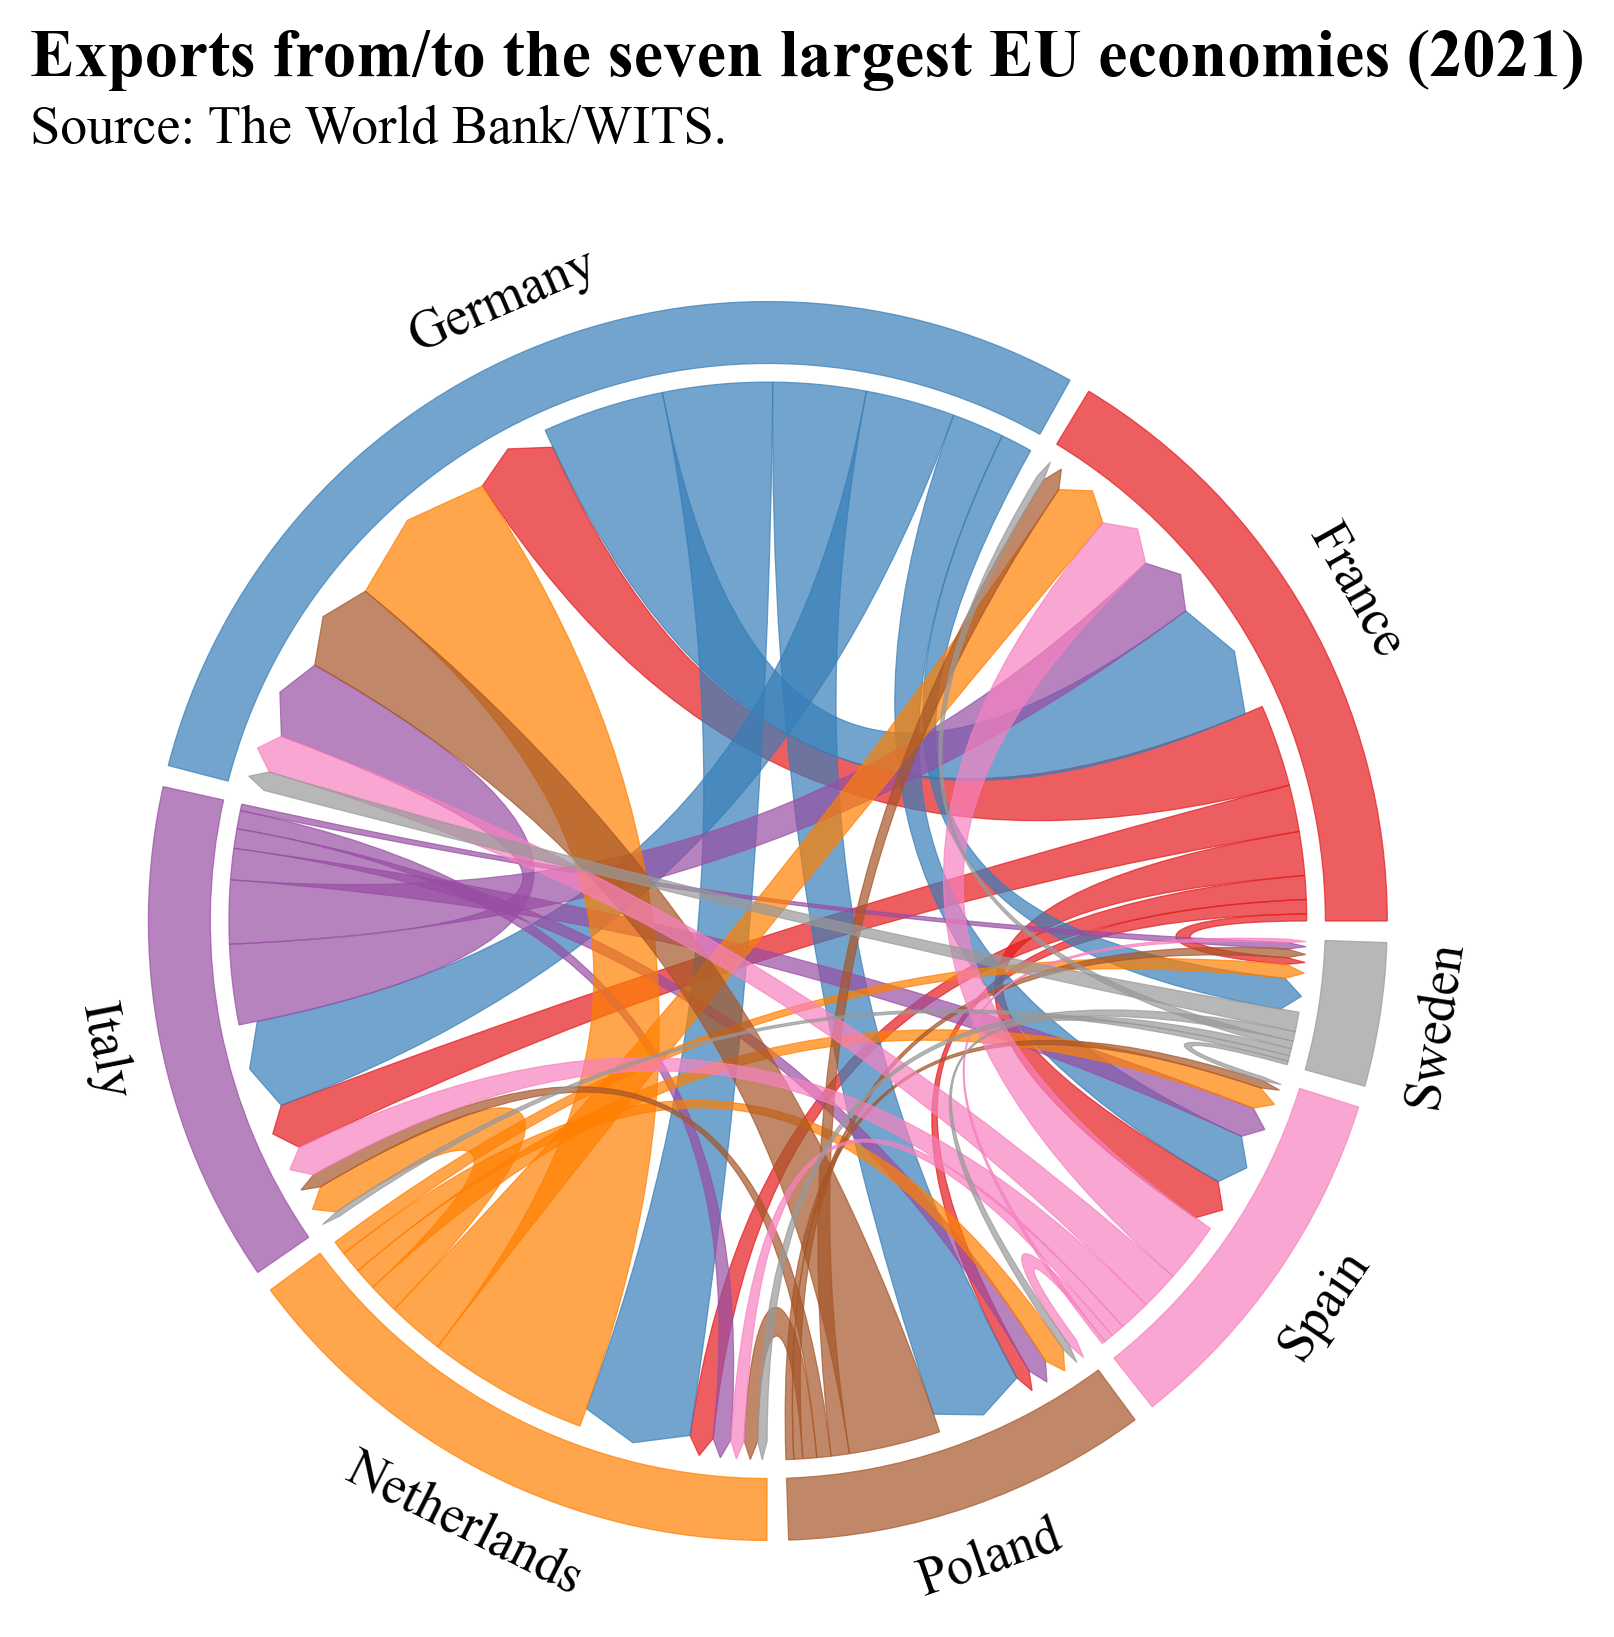
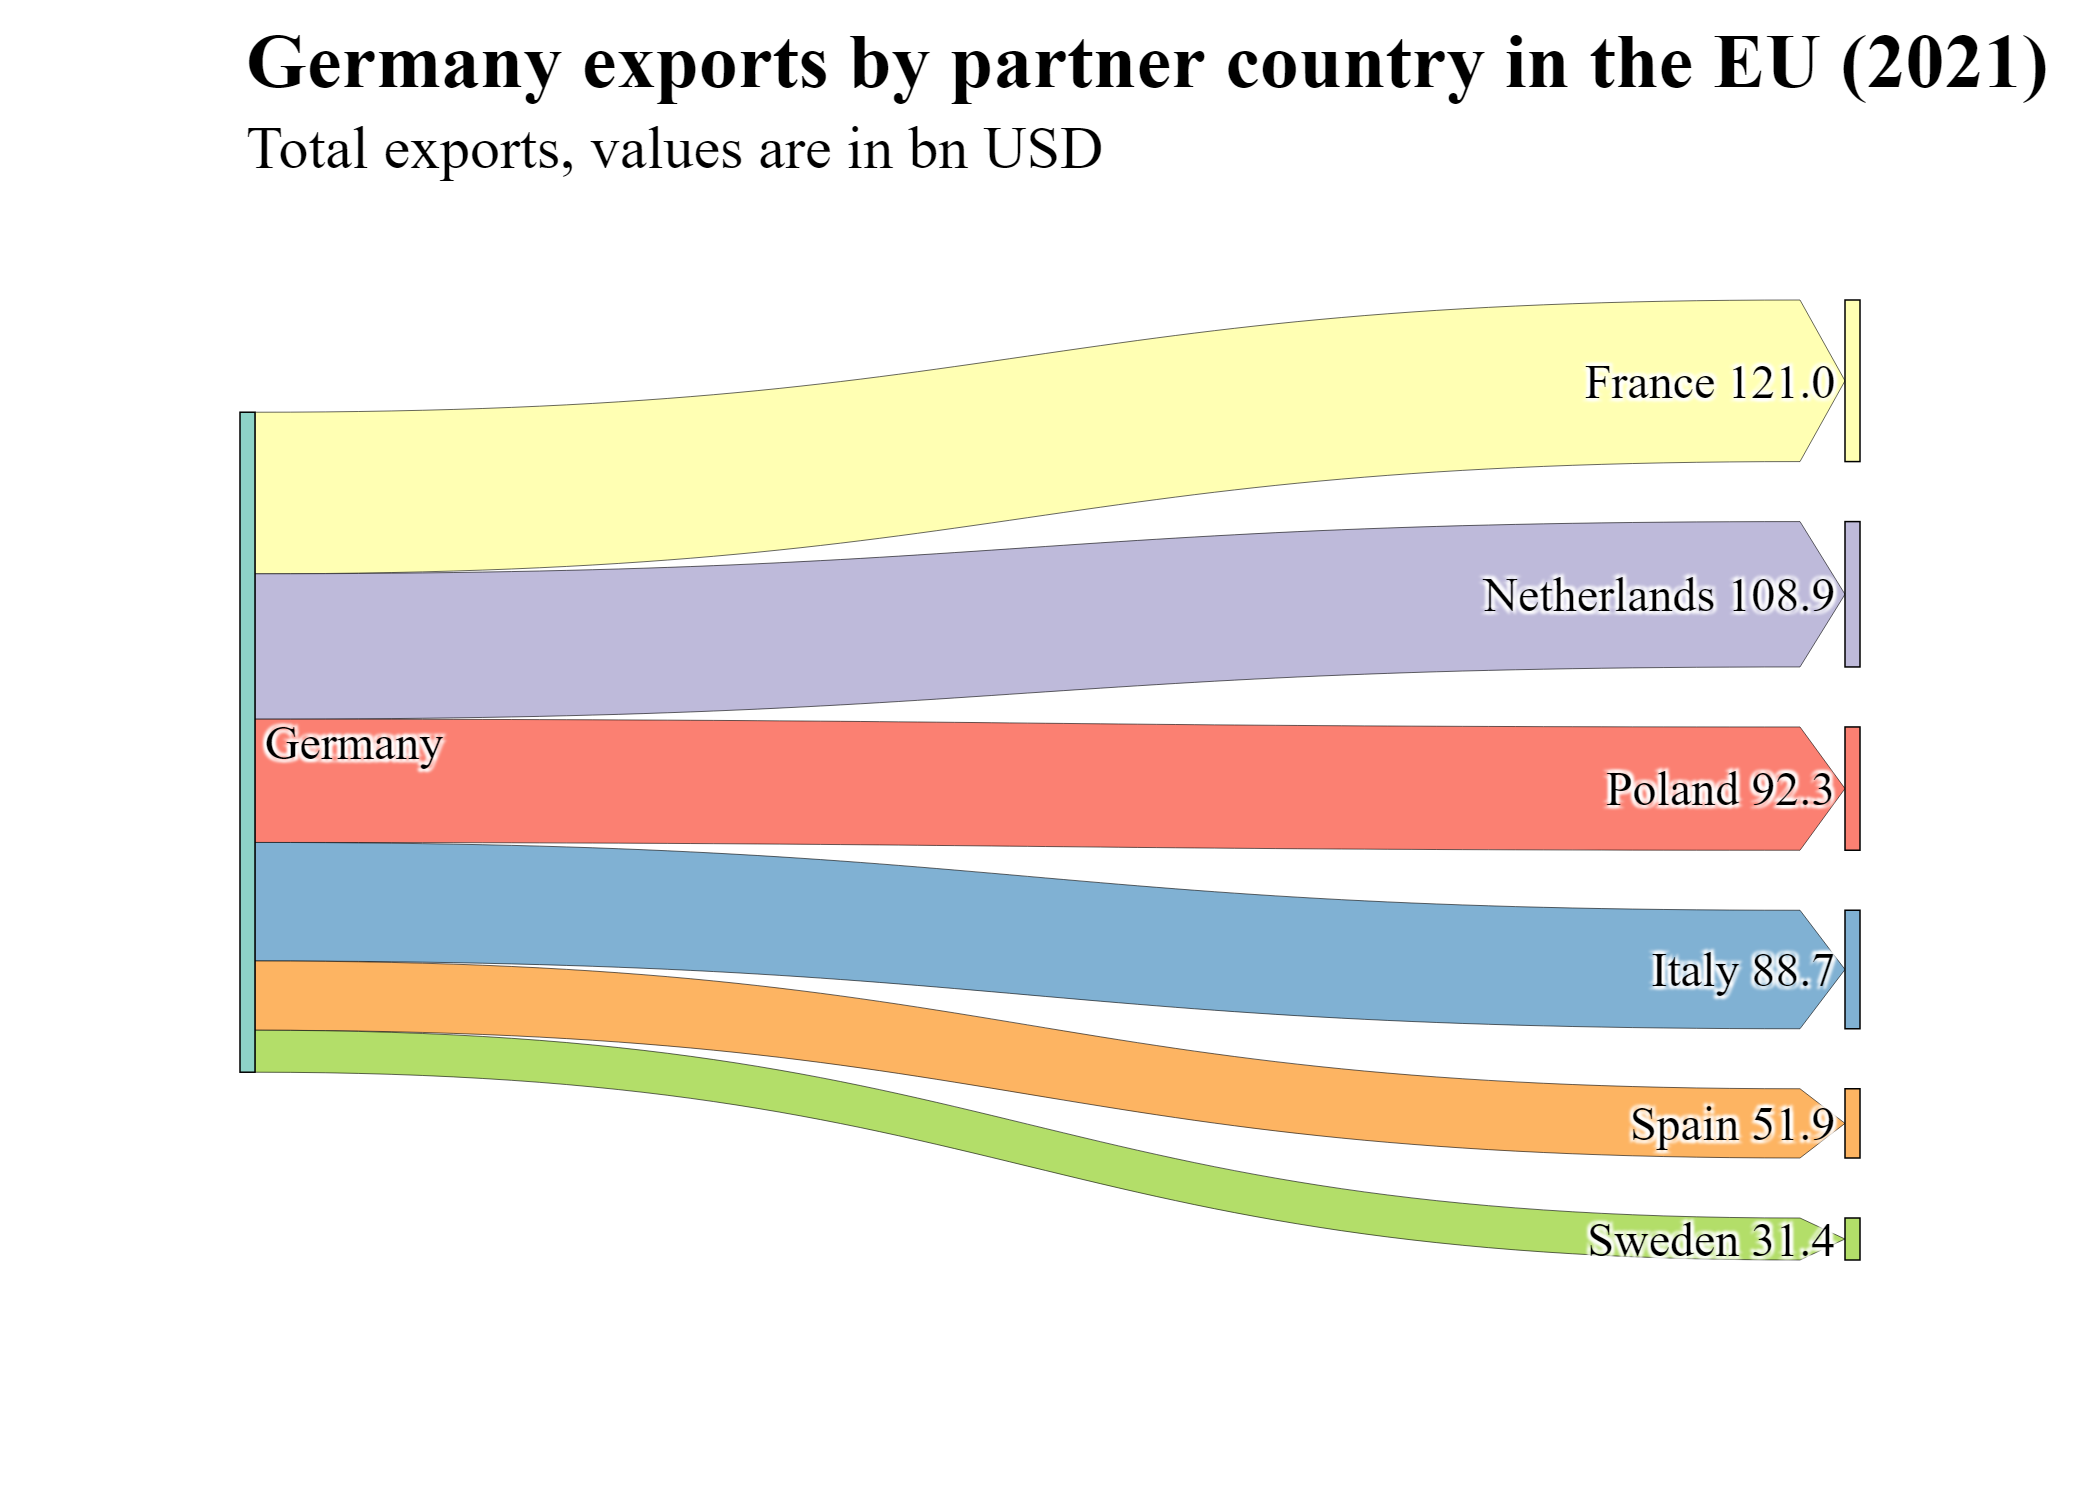
Relations
| Chord diagram (directed) | Sankey diagram (one to many) |
|---|---|
 |
 |
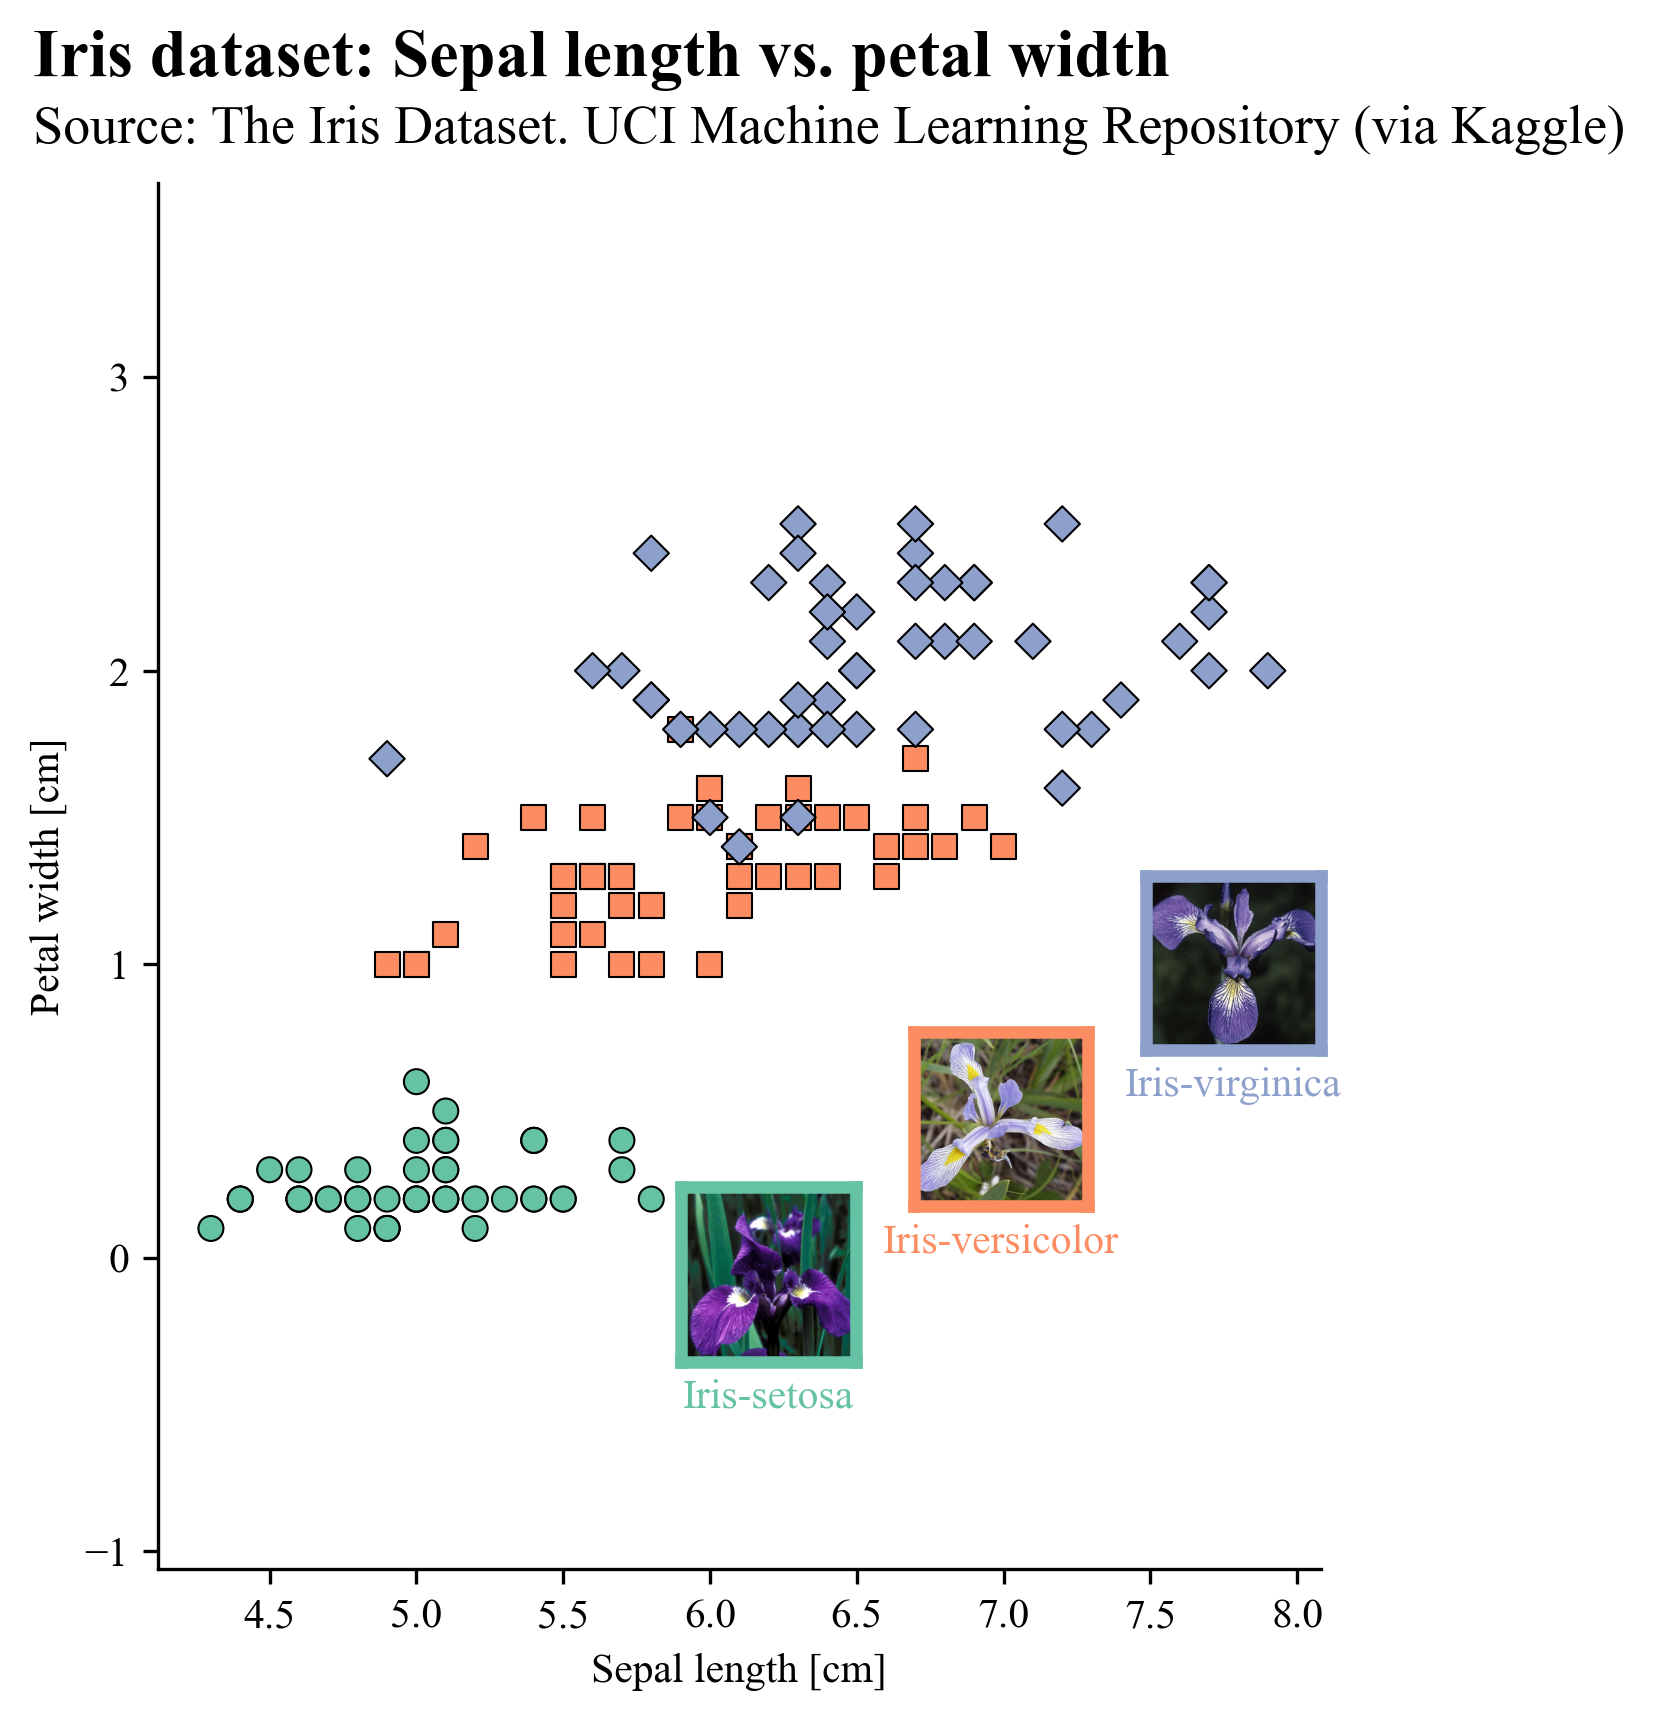
Bivariate Data
| Scatter plot (fancy version) | Scatter plot matrix |
|---|---|
 |
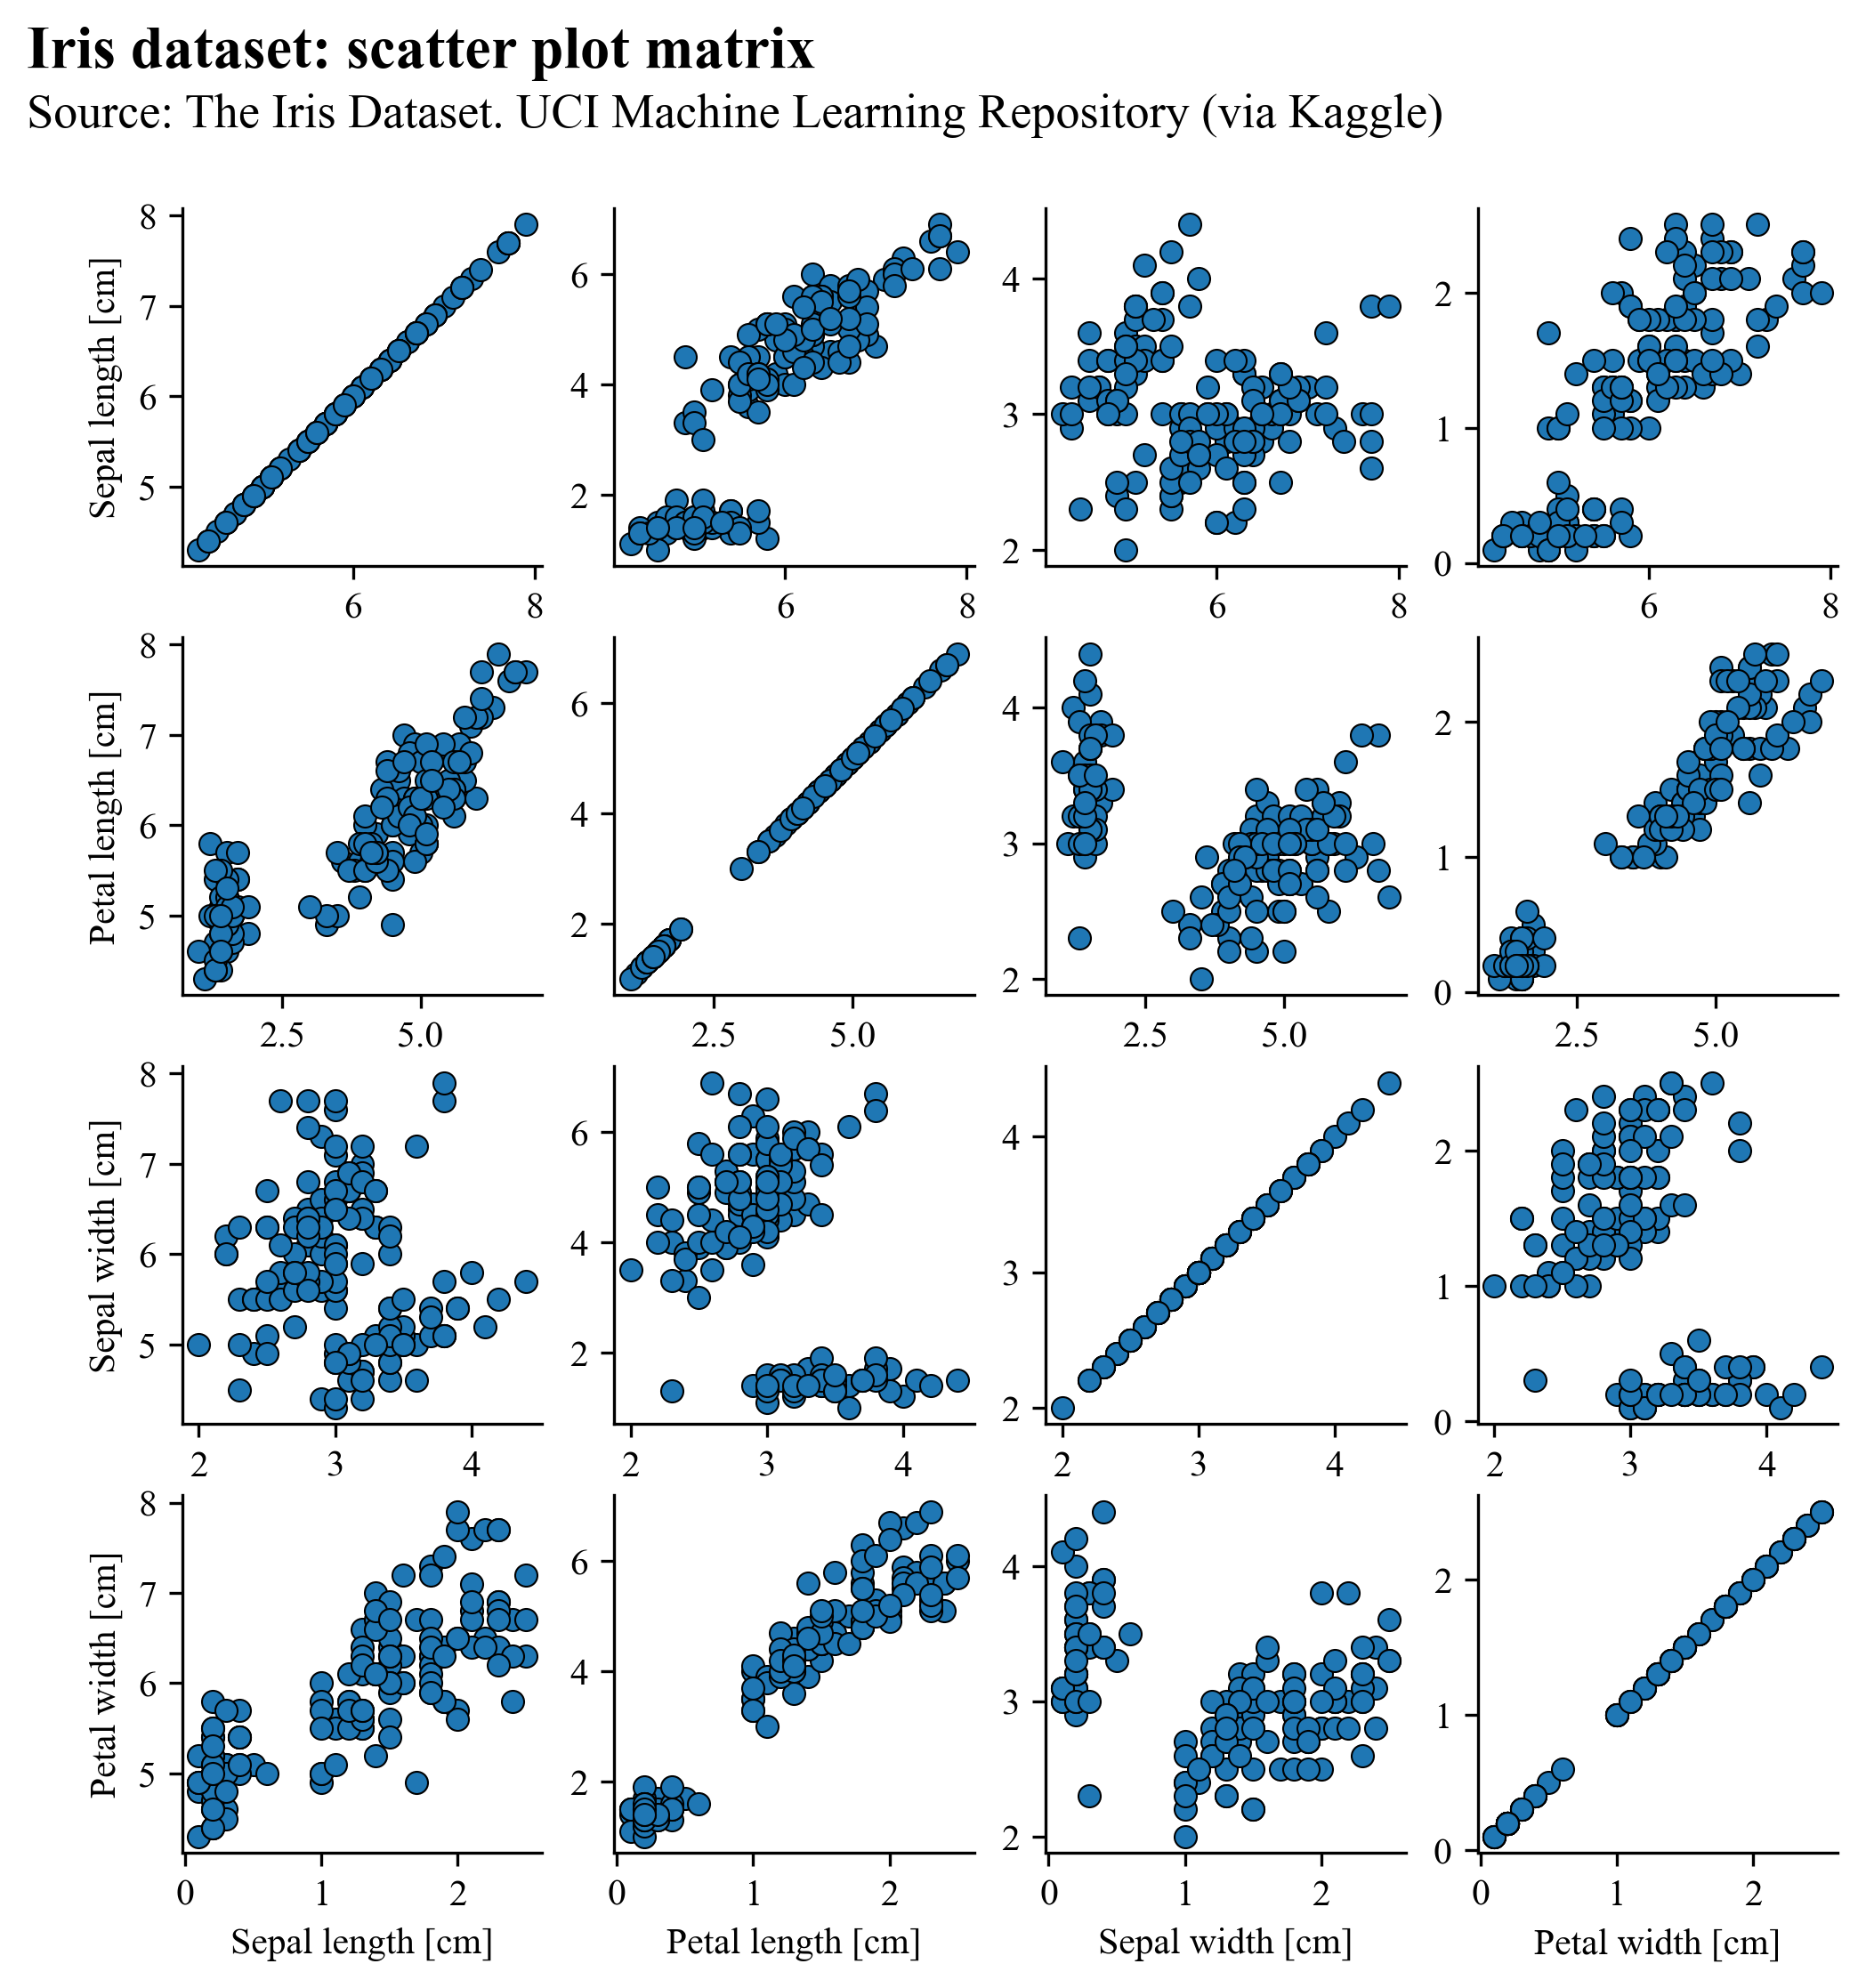 |
Trivariate data
| Scatter bubble plot | Lattice bubble plot |
|---|---|
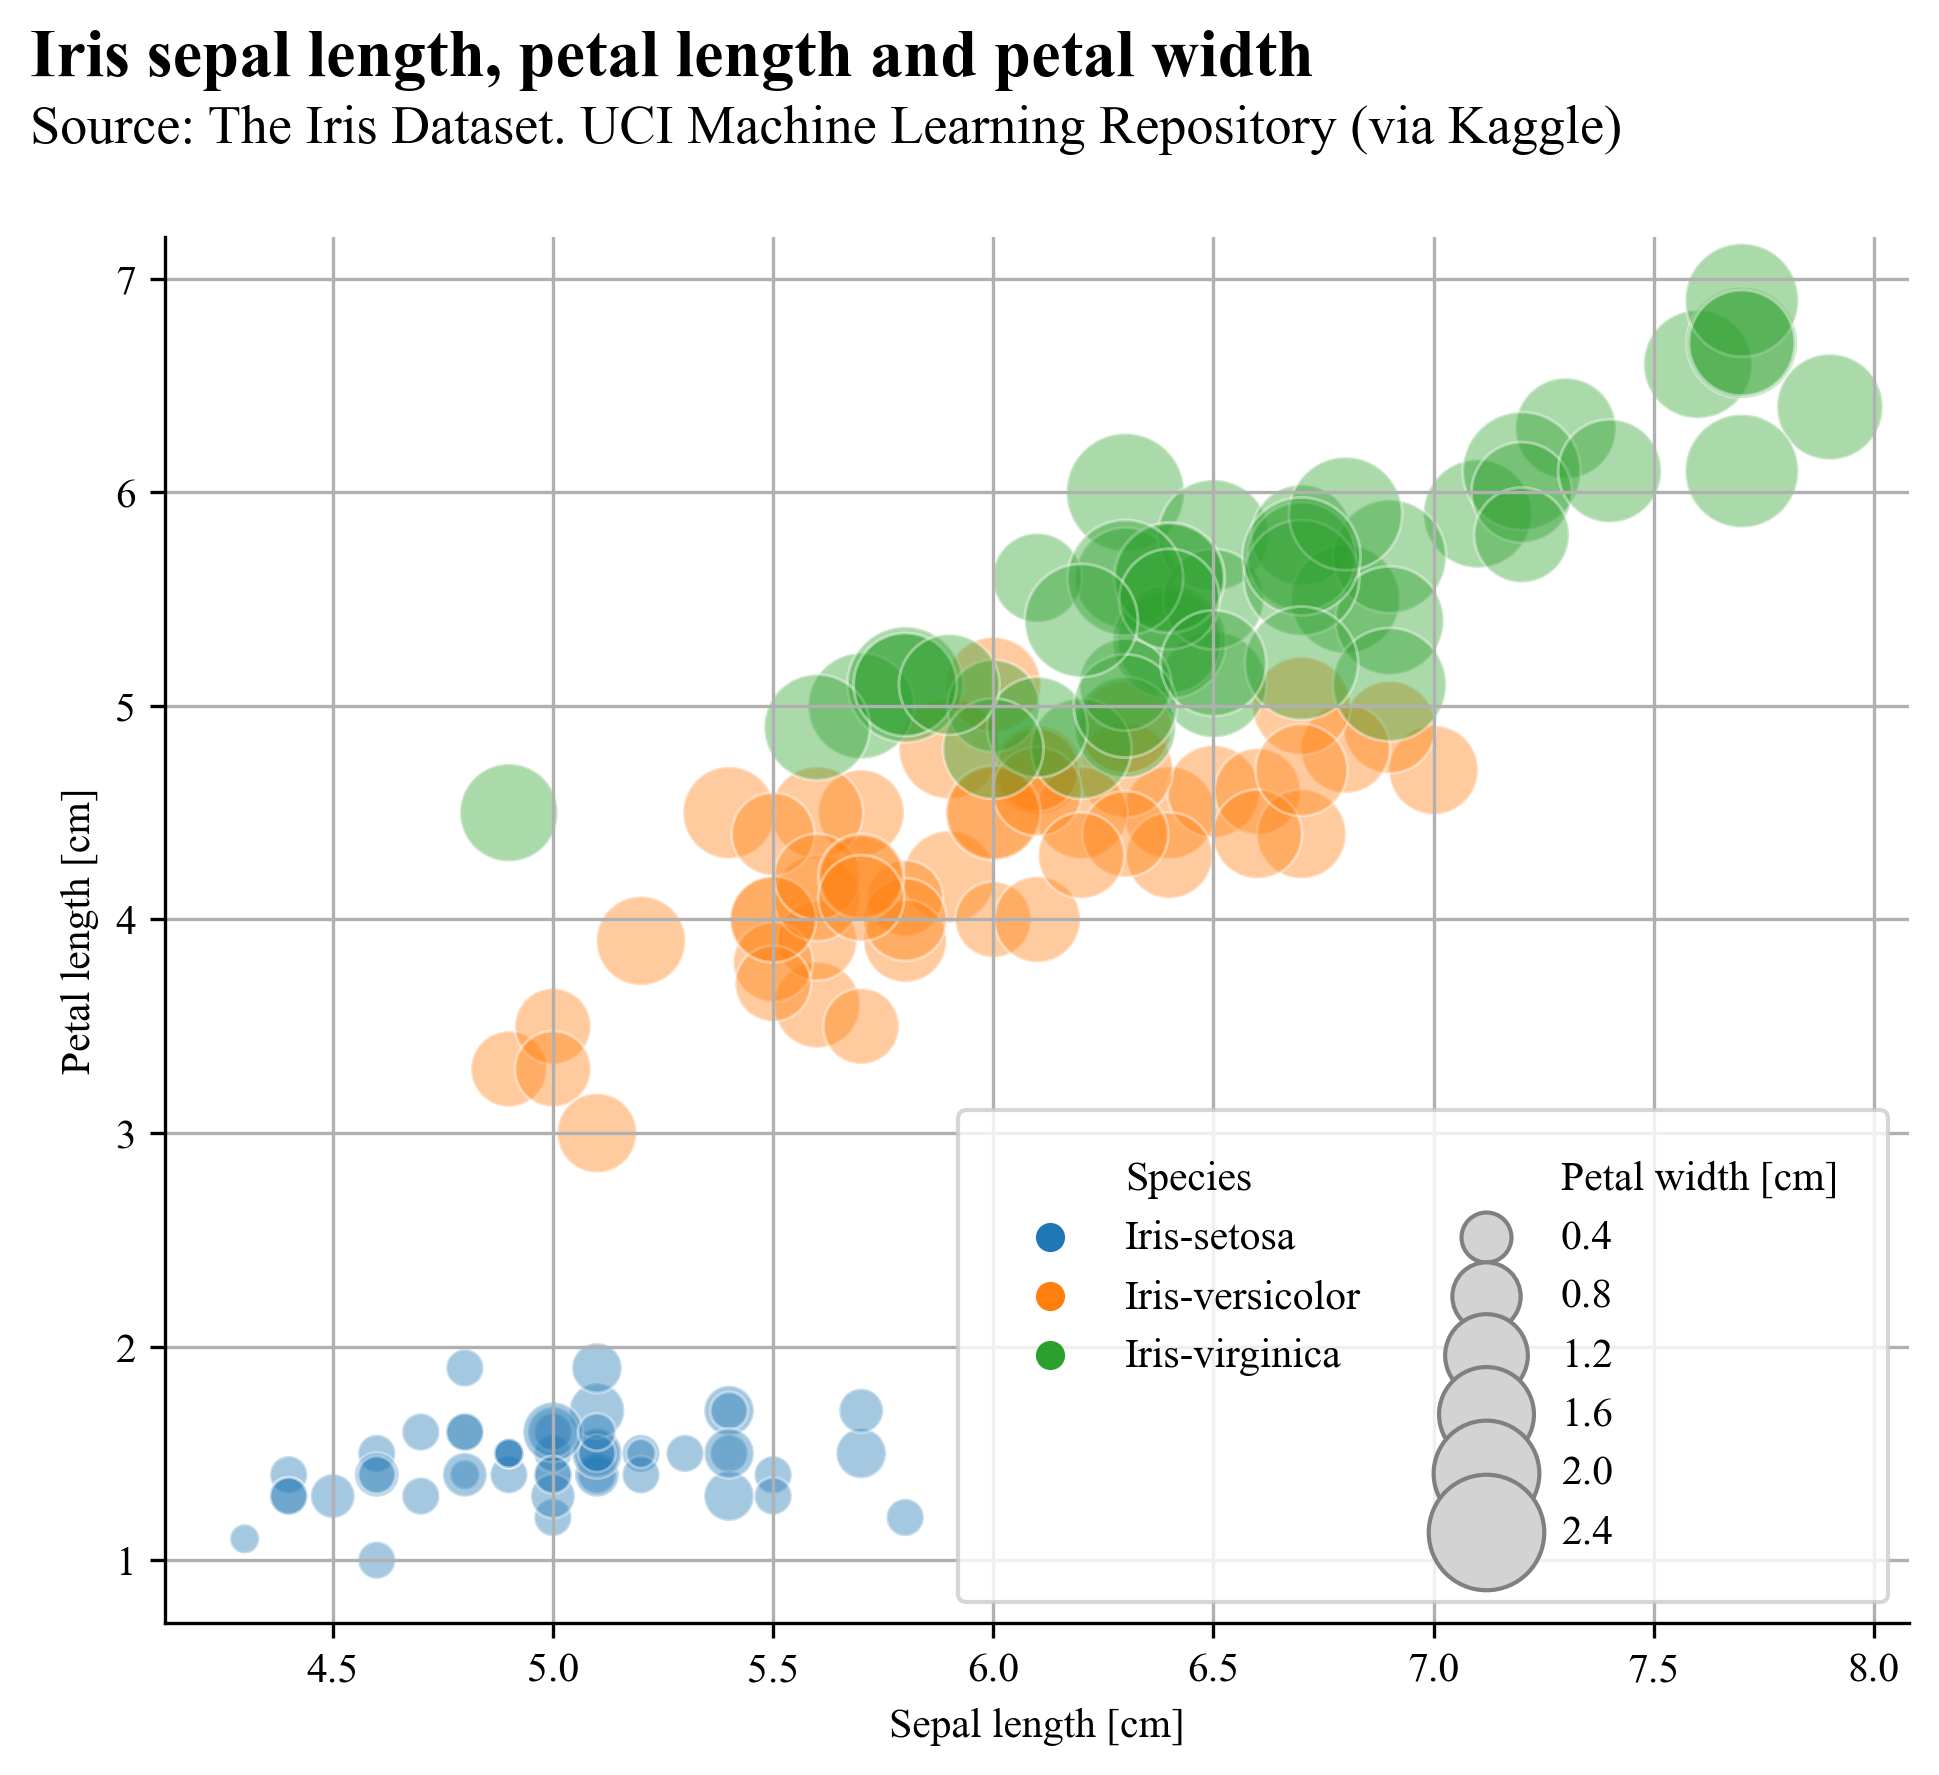 |
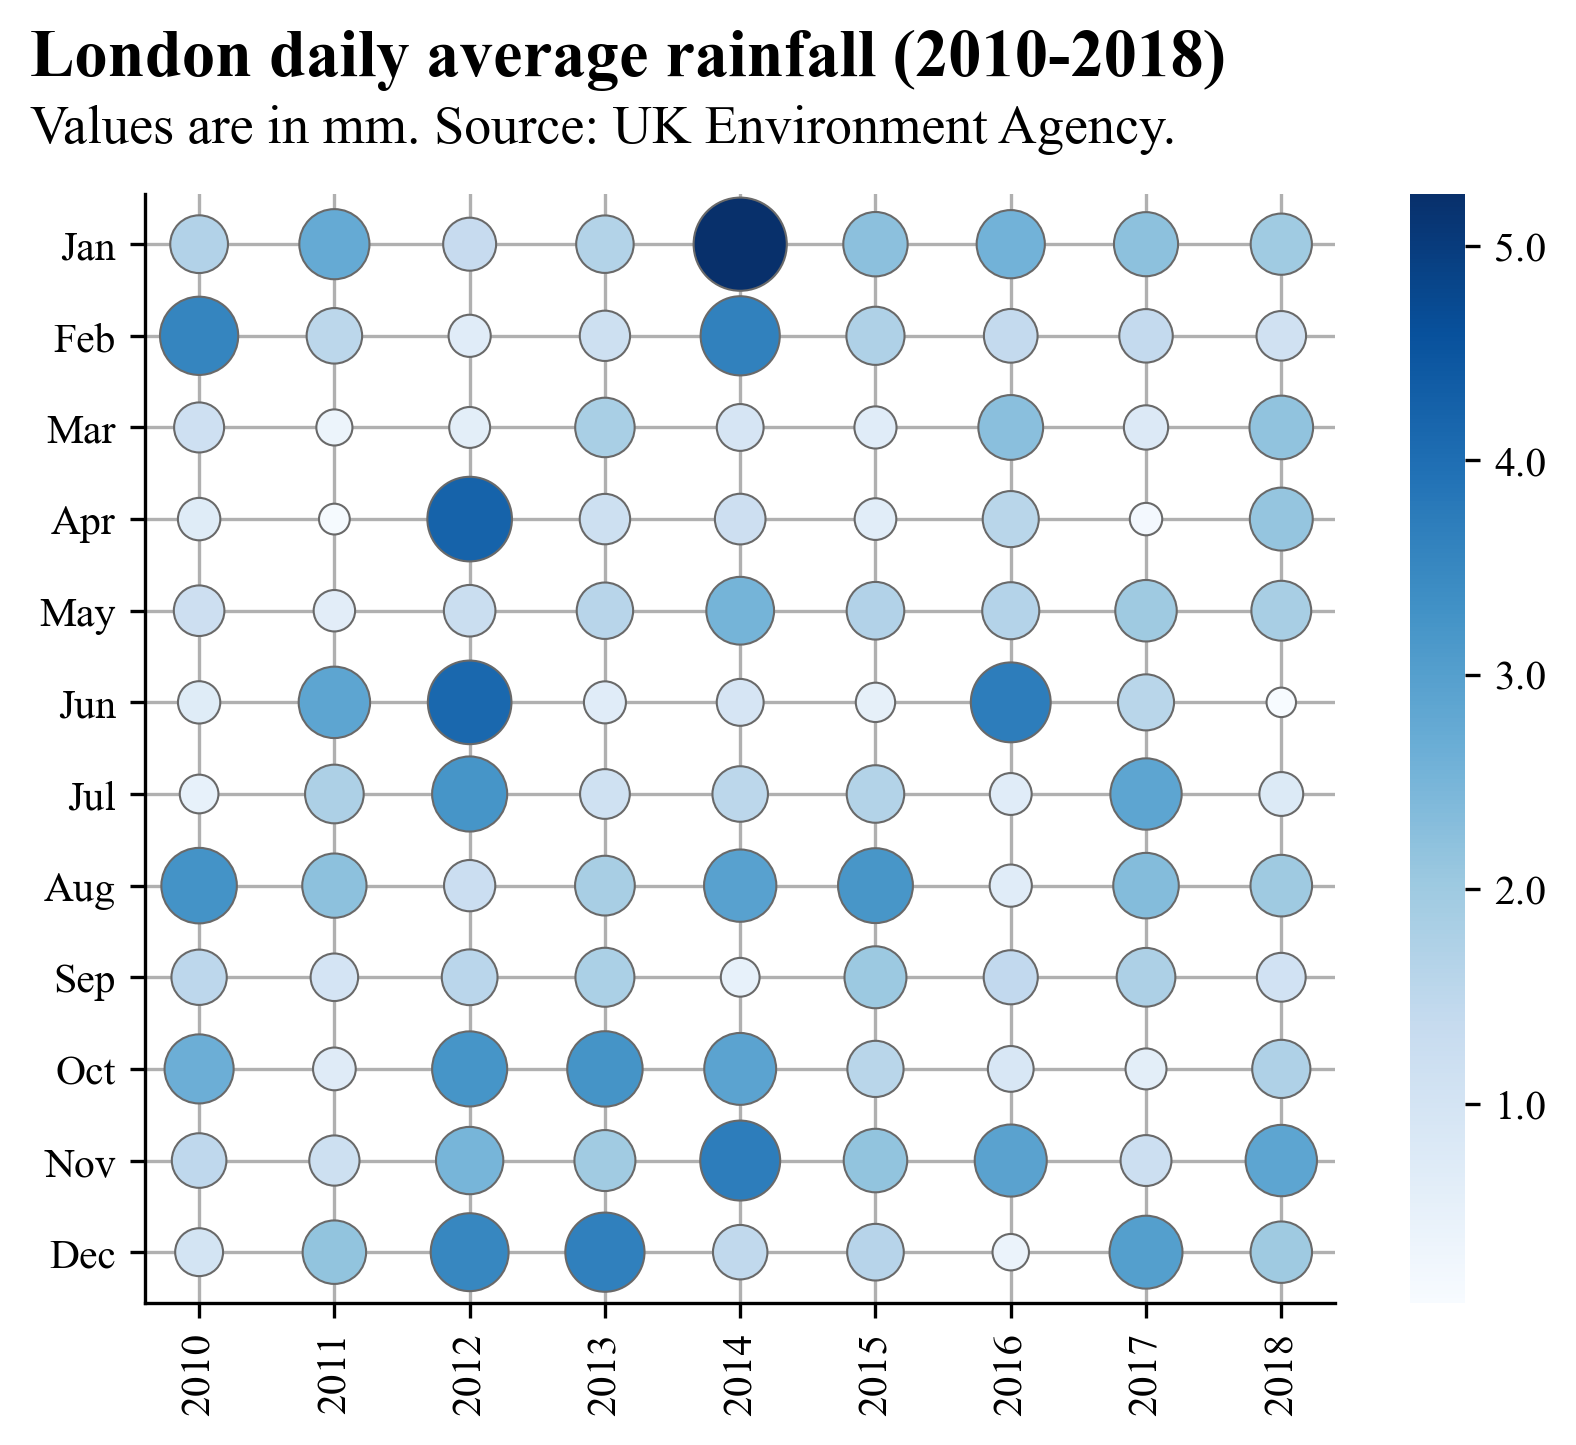 |
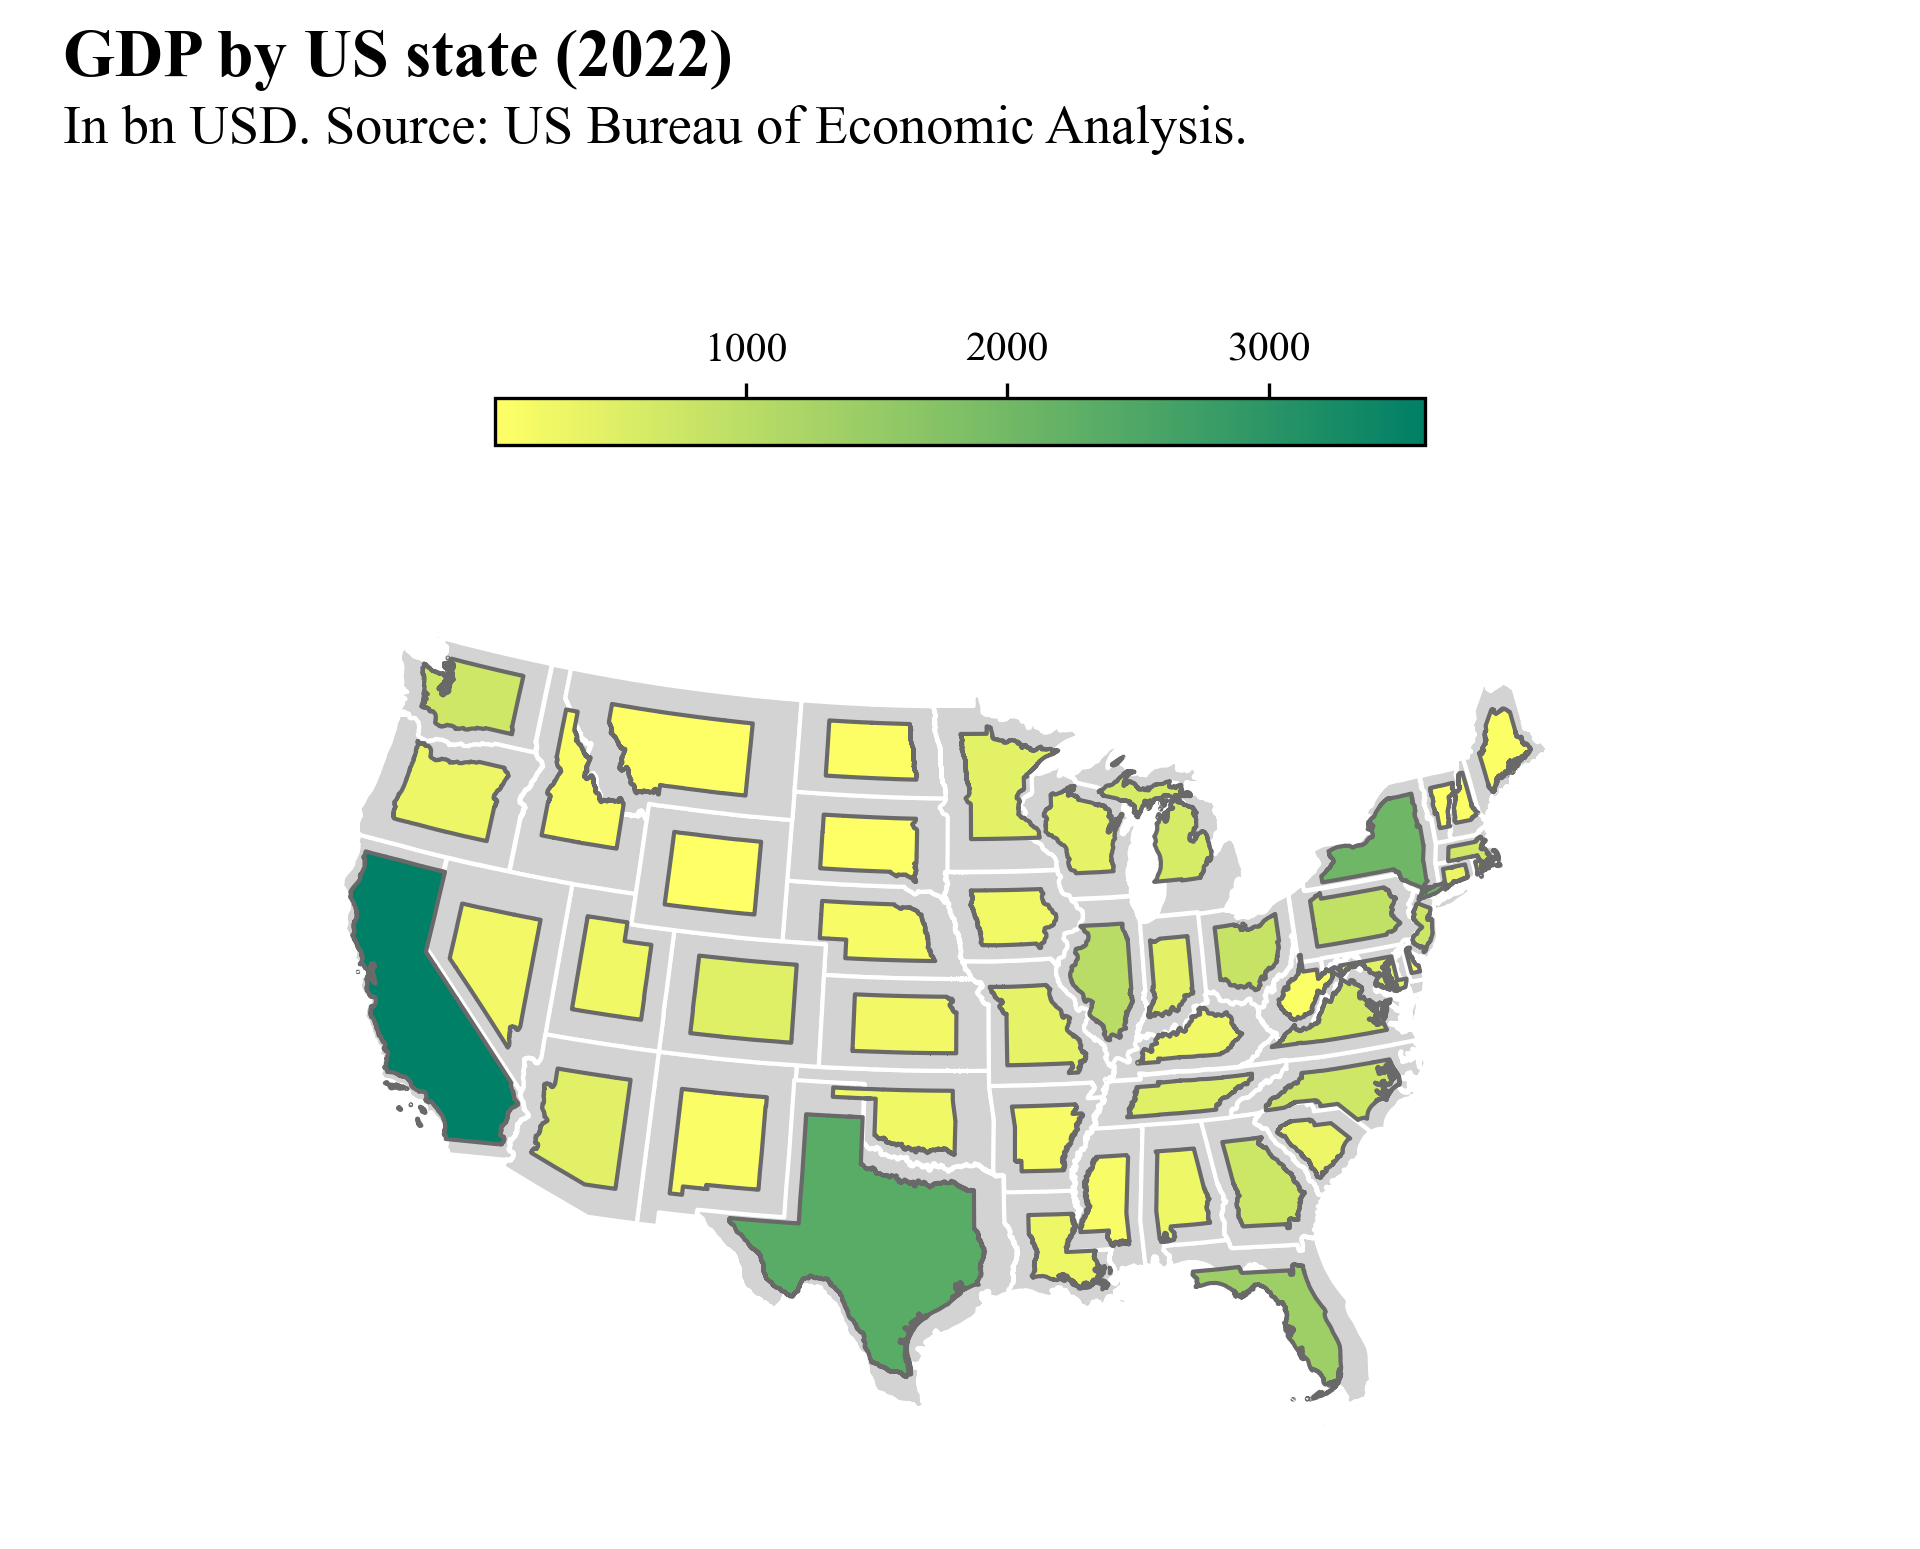
Geospatial data
| Choroplet map | Cartogram |
|---|---|
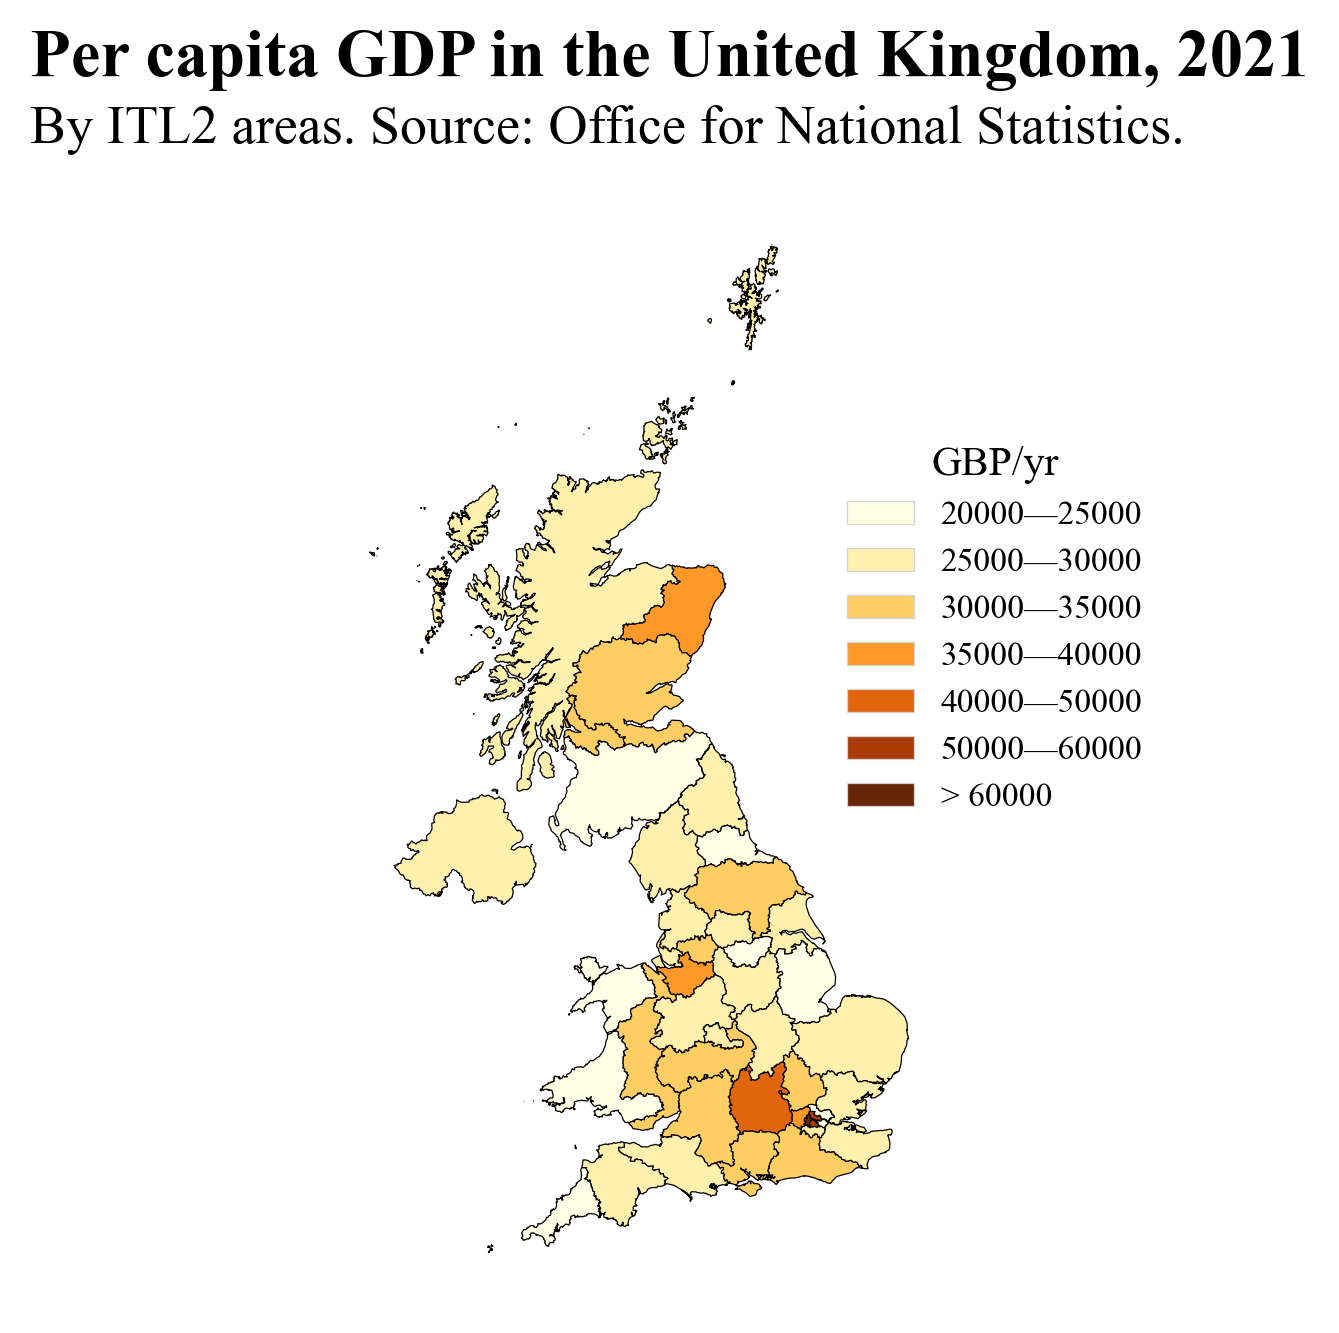 |
 |
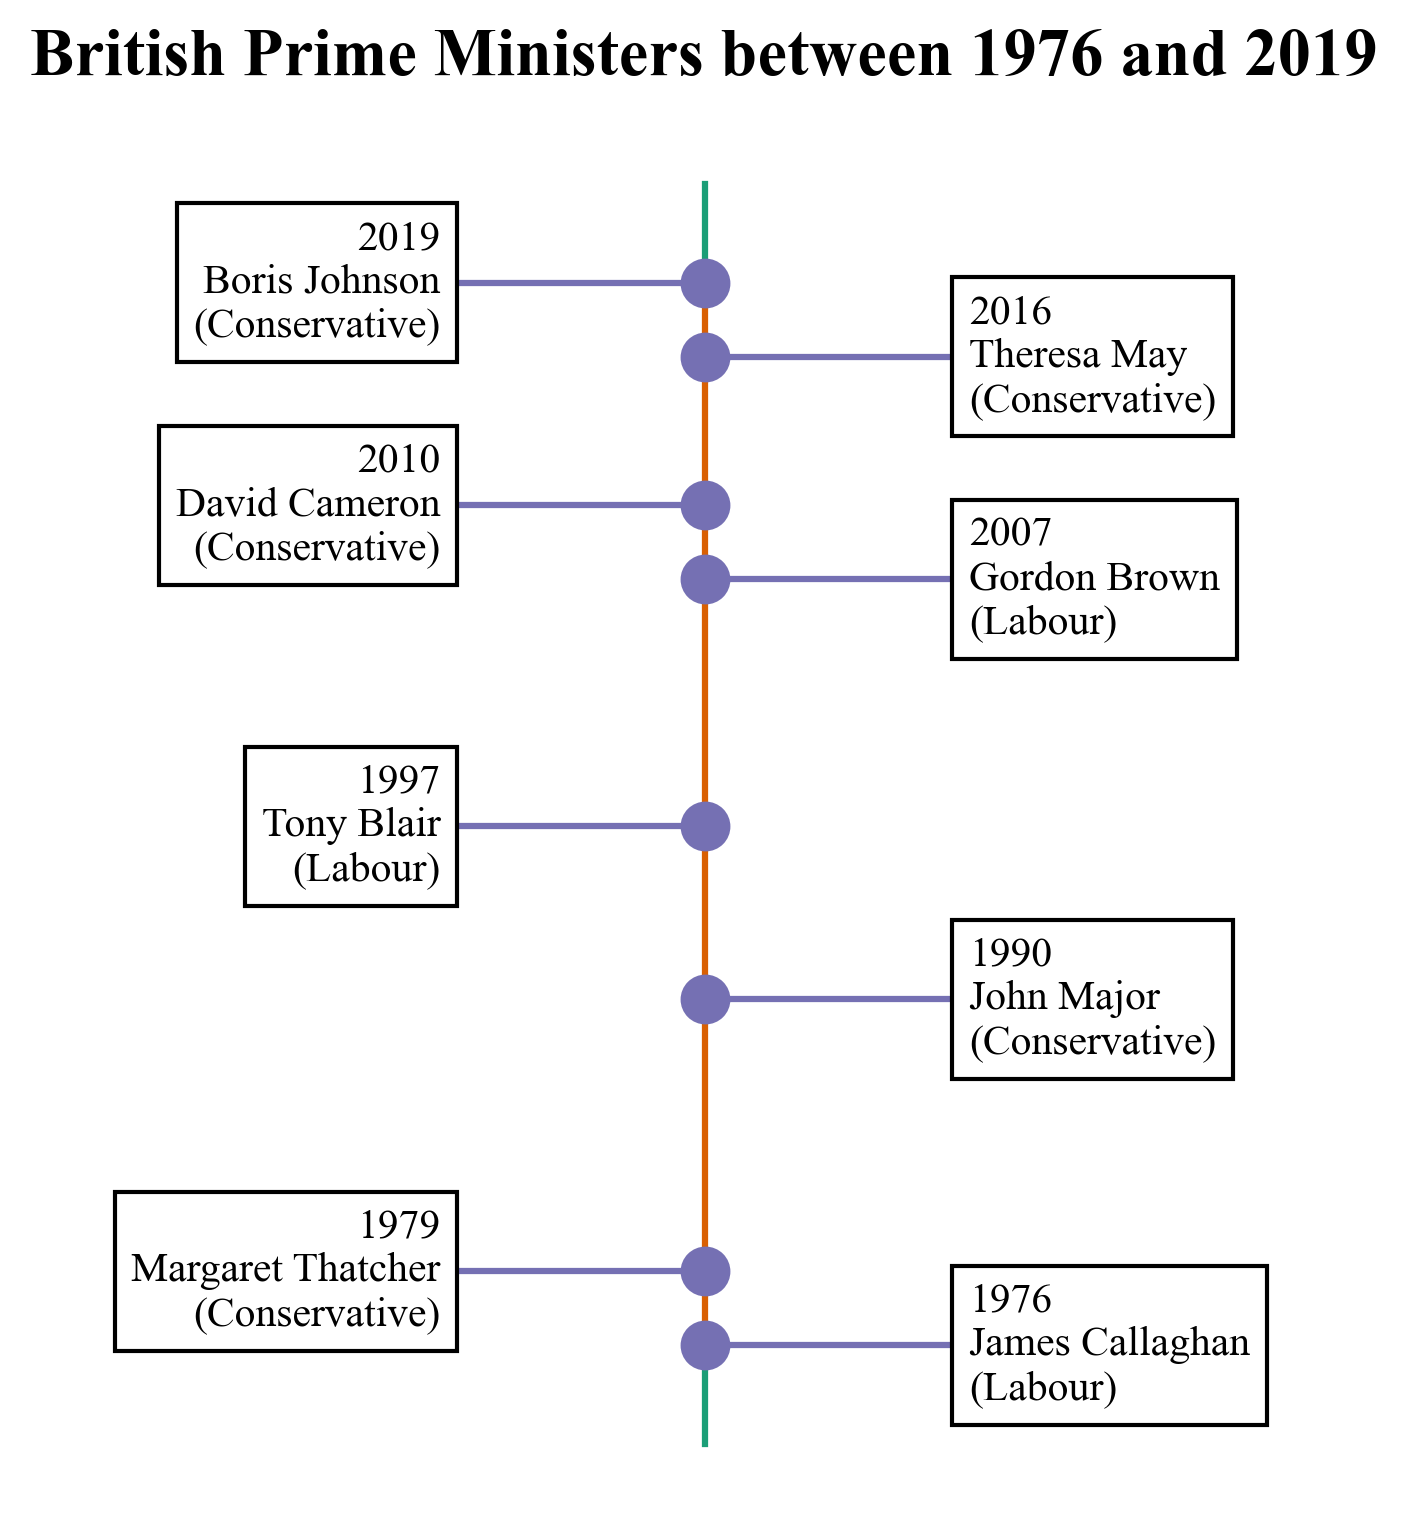
Timelines
| Horizontal timeline |
|---|
 |
| Vertical timeline |
|---|
 |
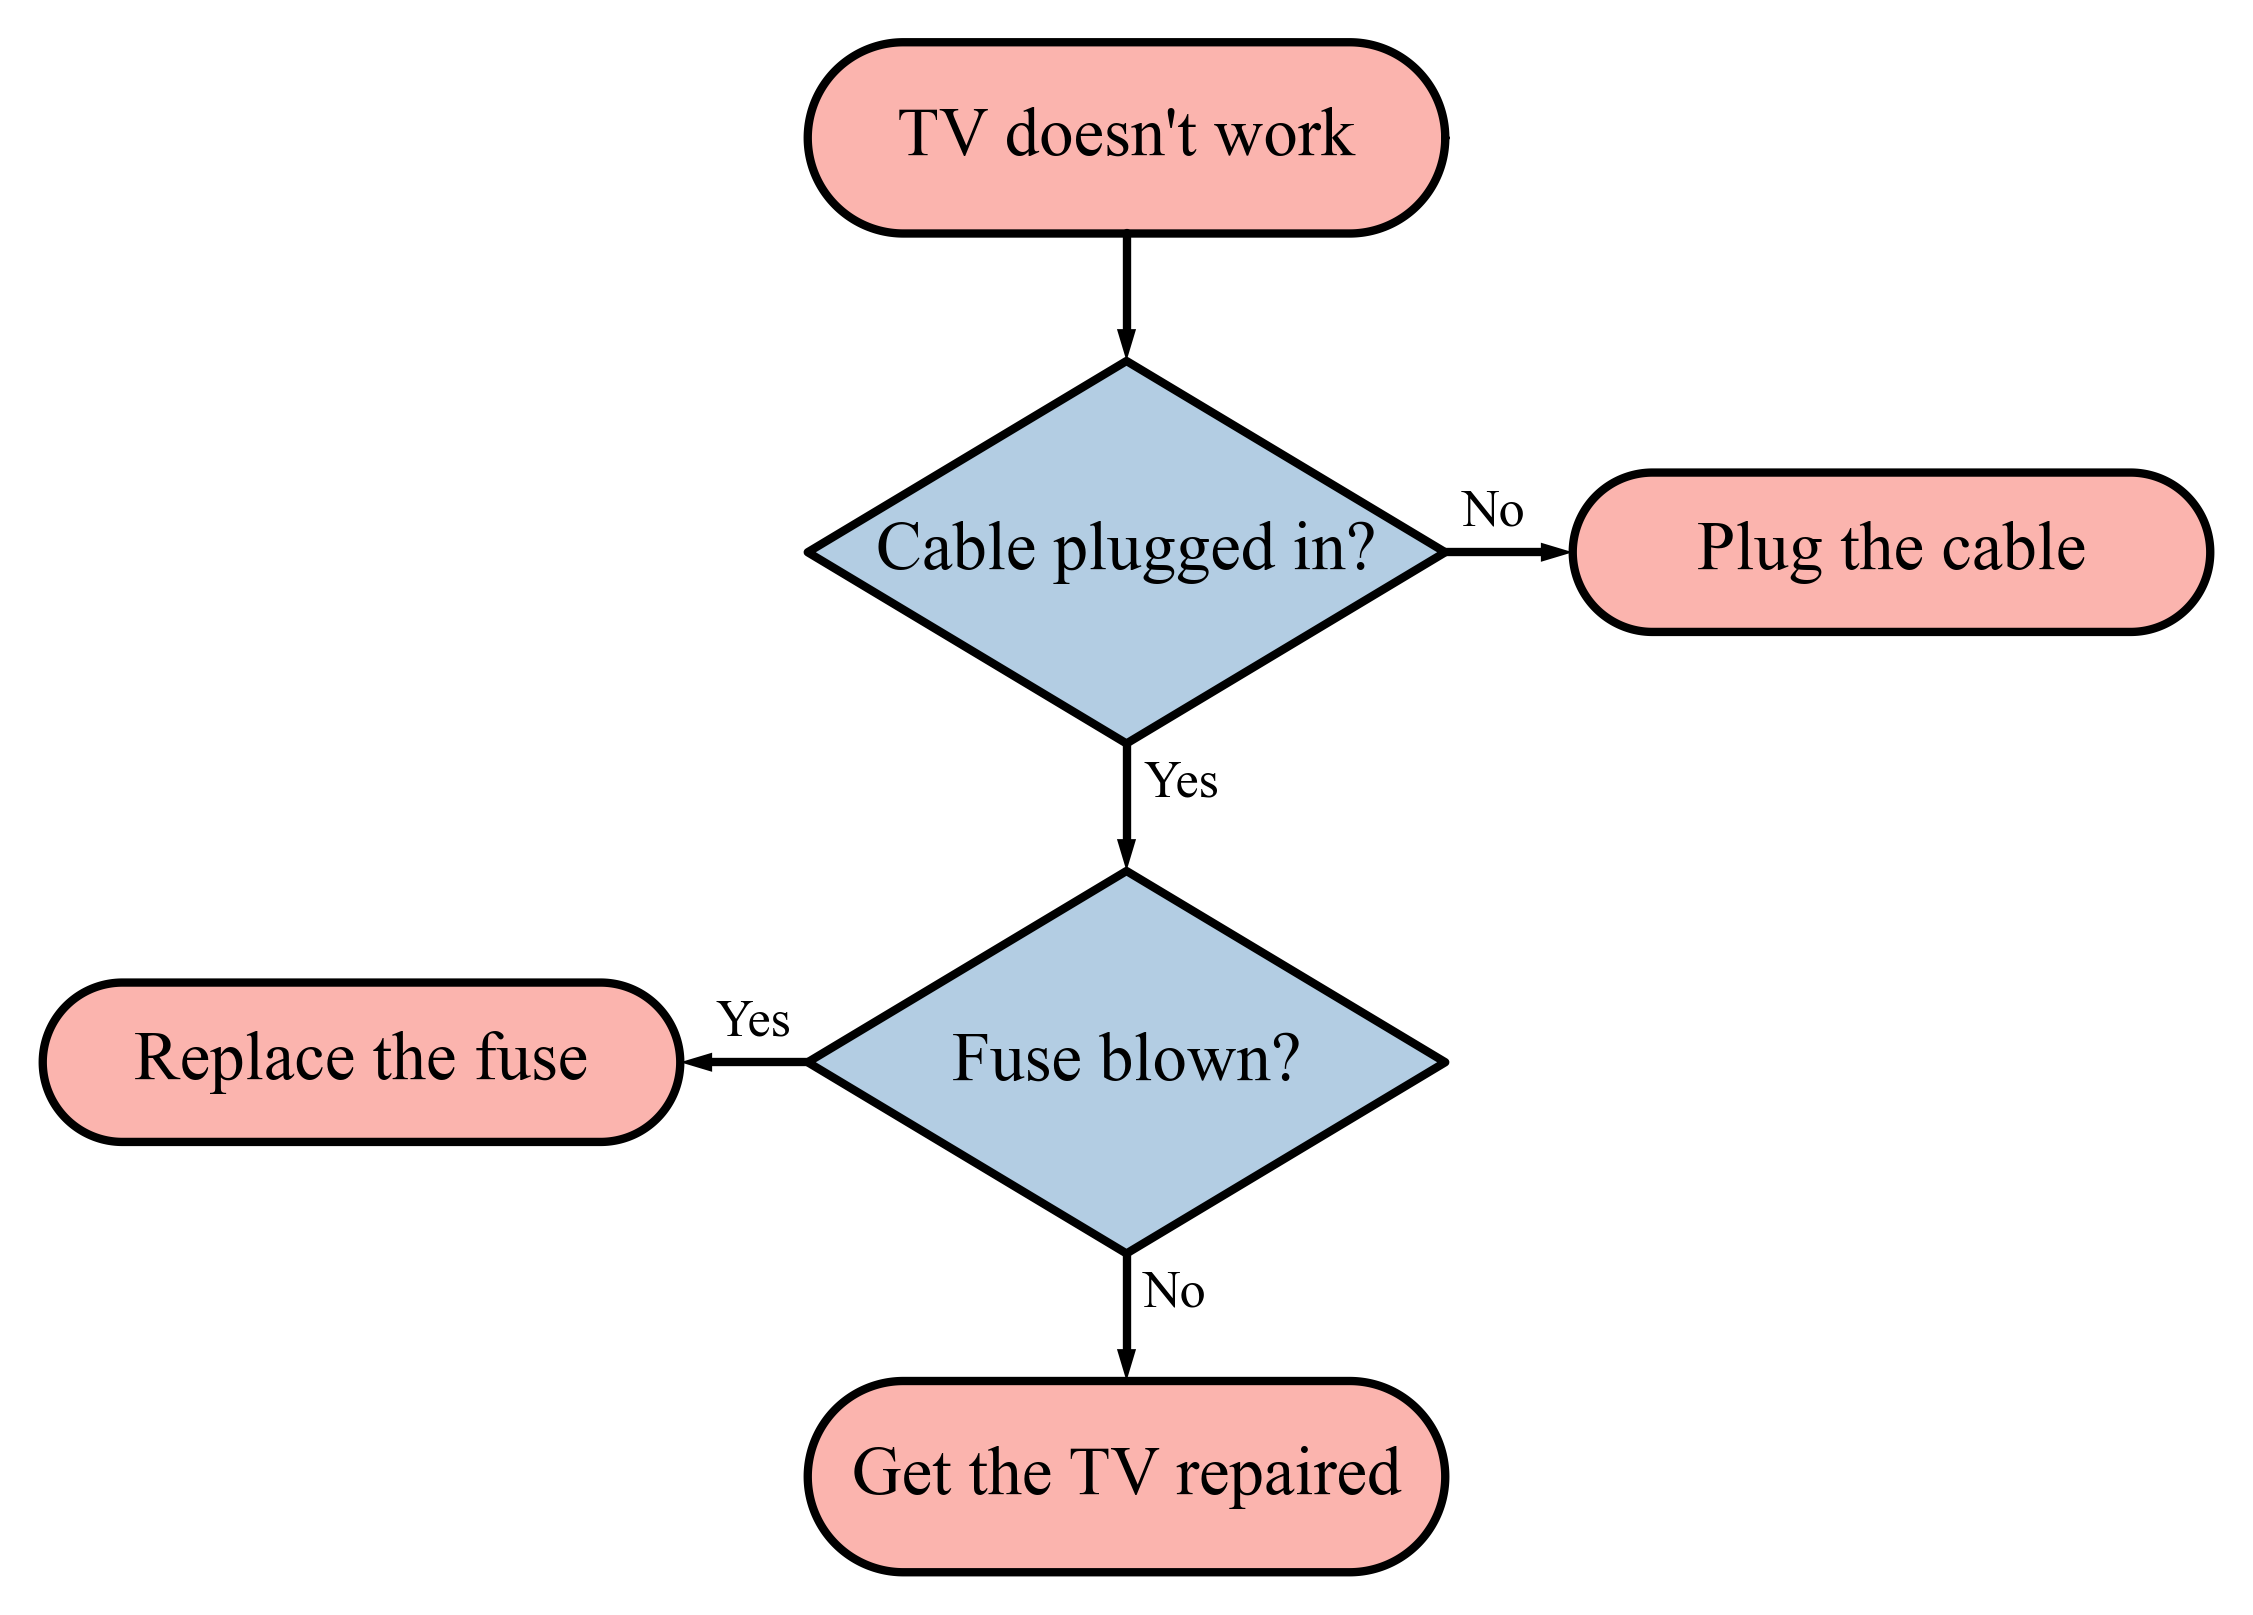
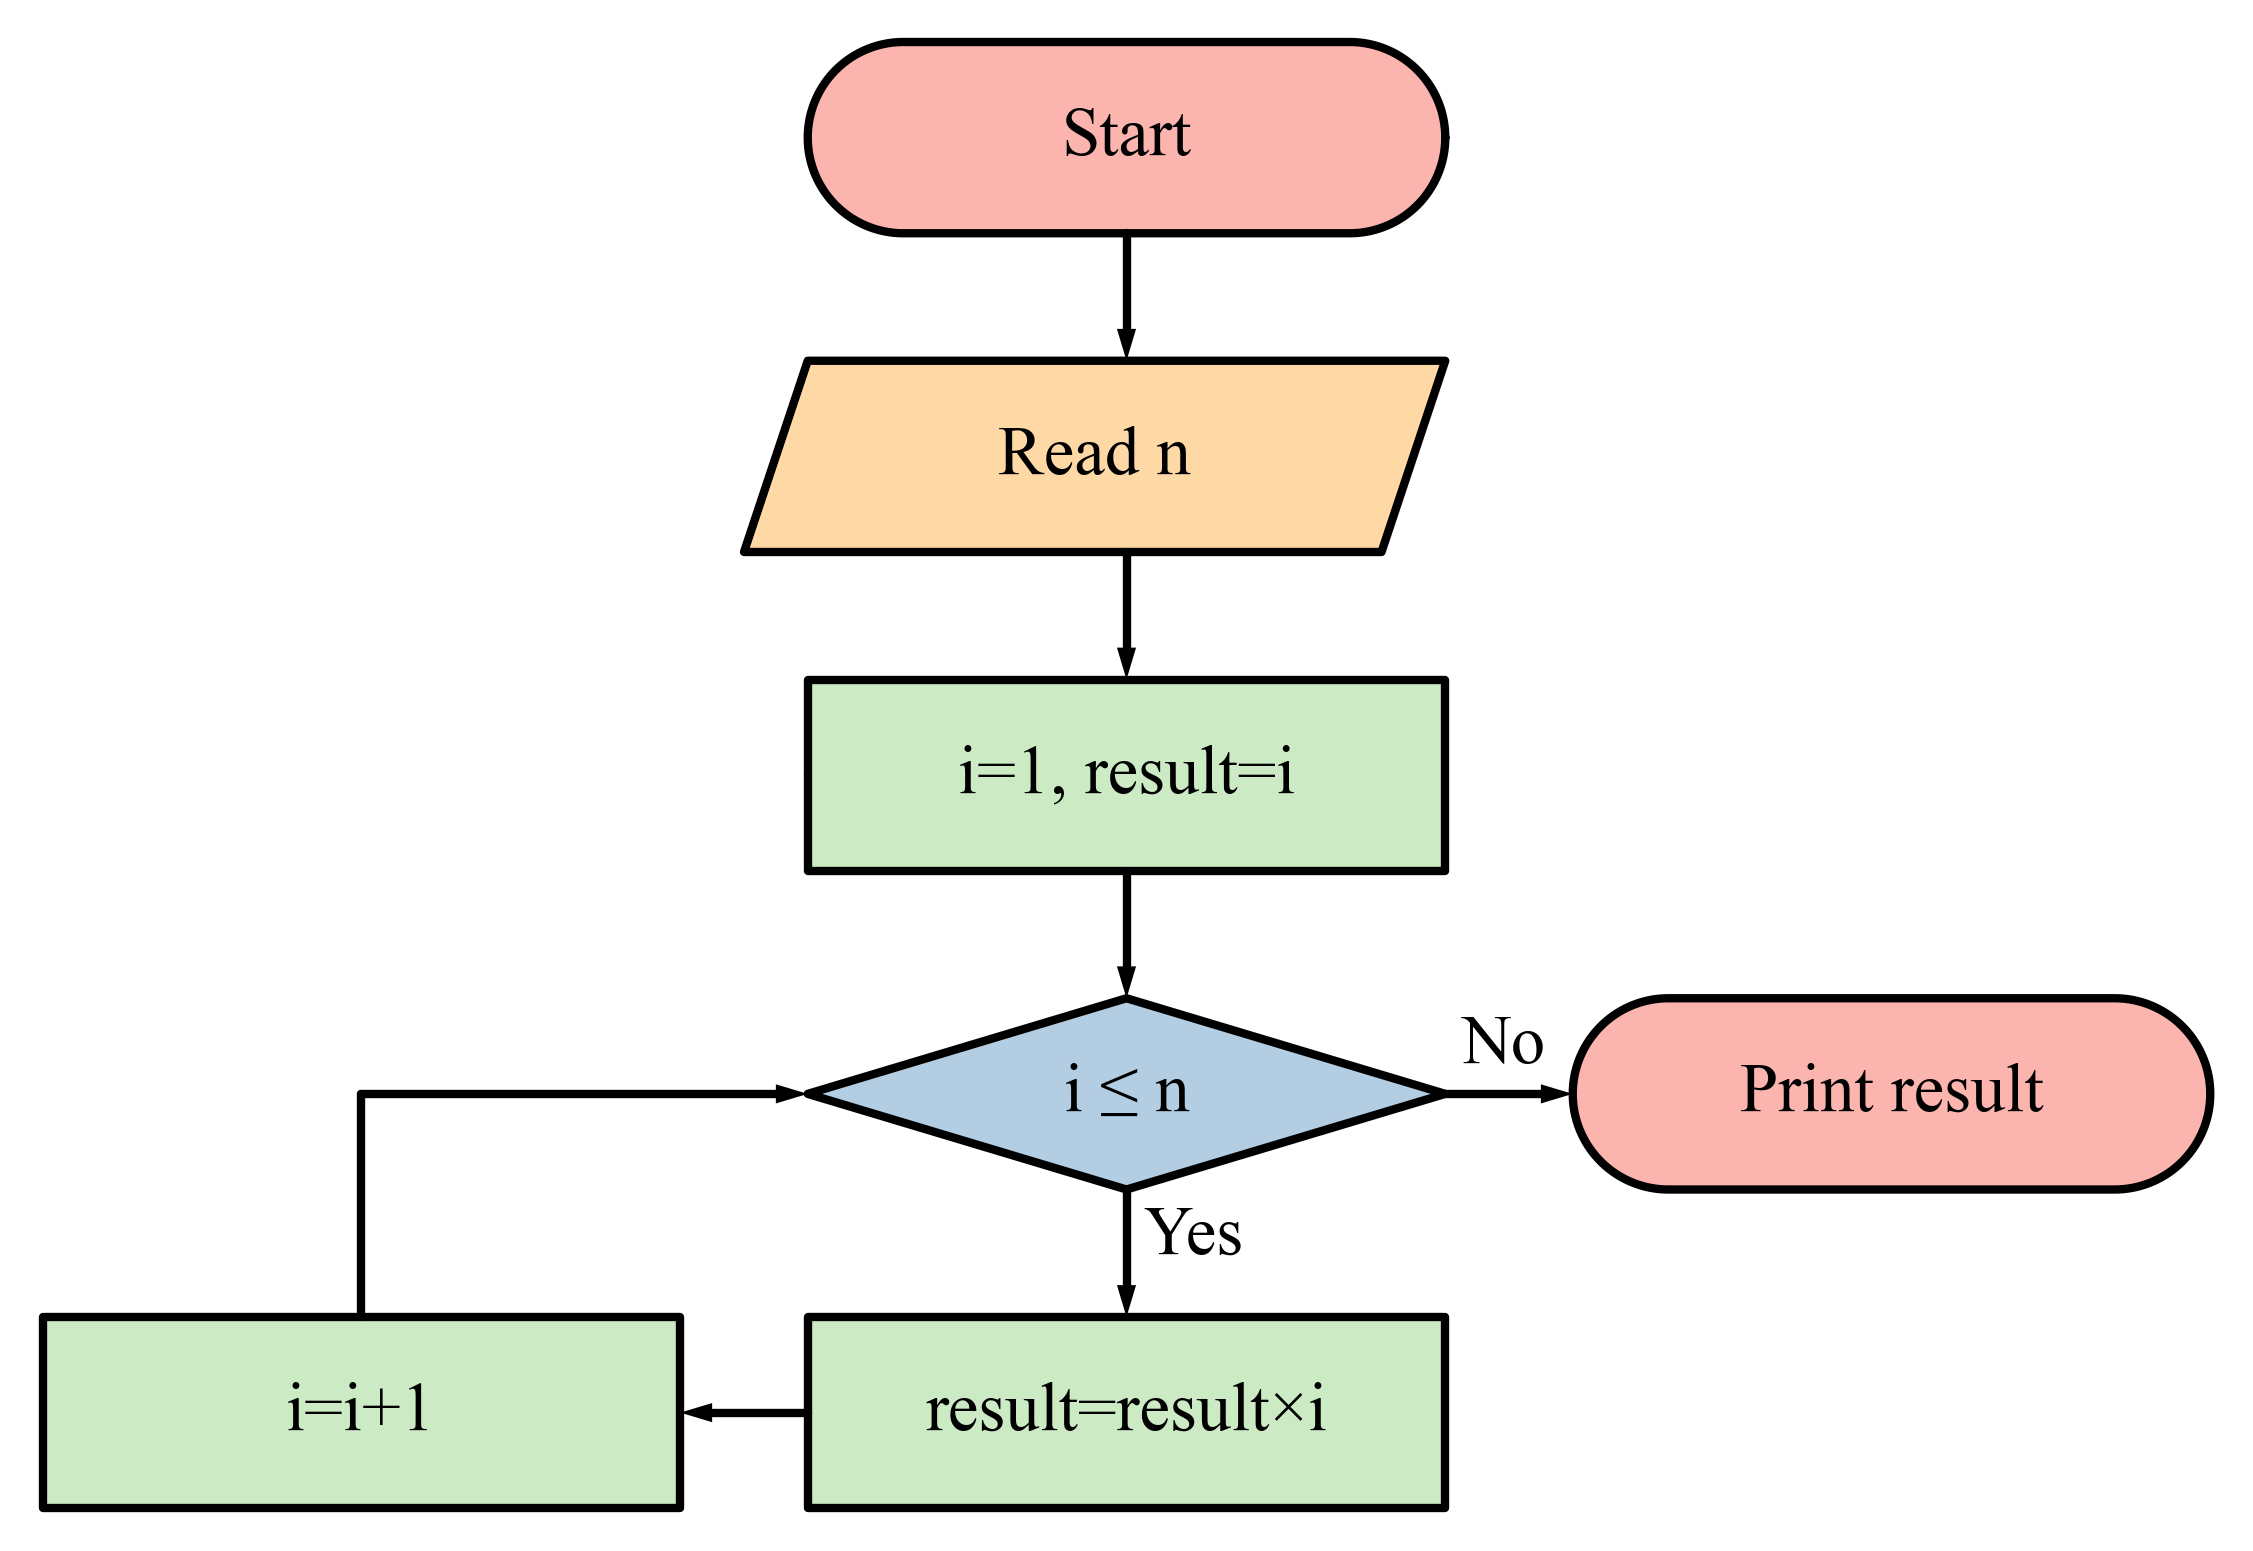
Flowcharts
| Fixing a household problem | Factorial of a number |
|---|---|
 |
 |
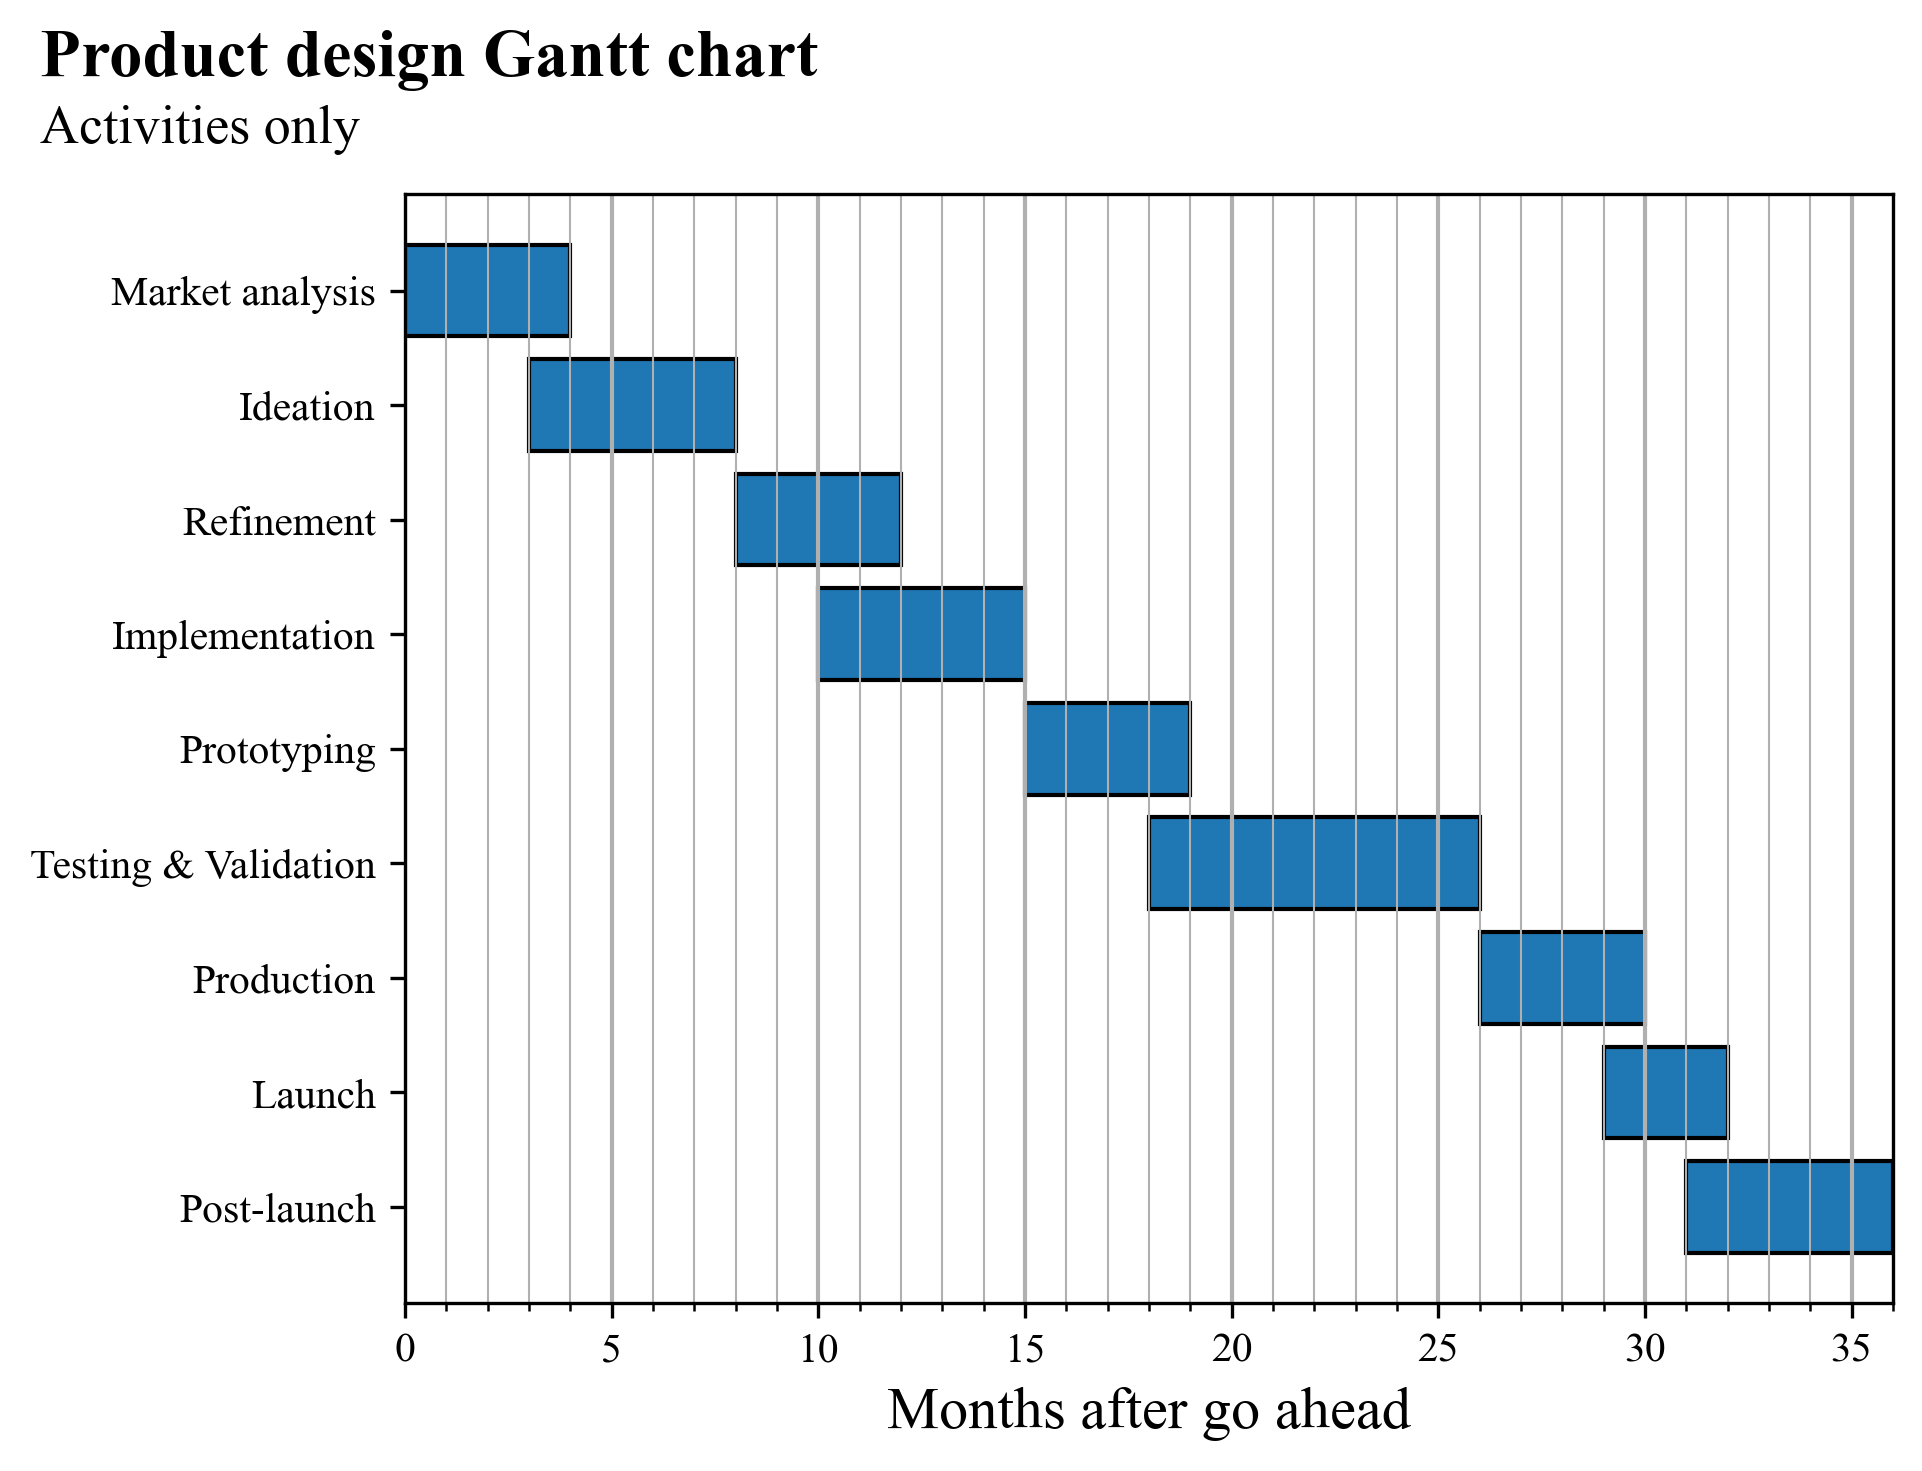
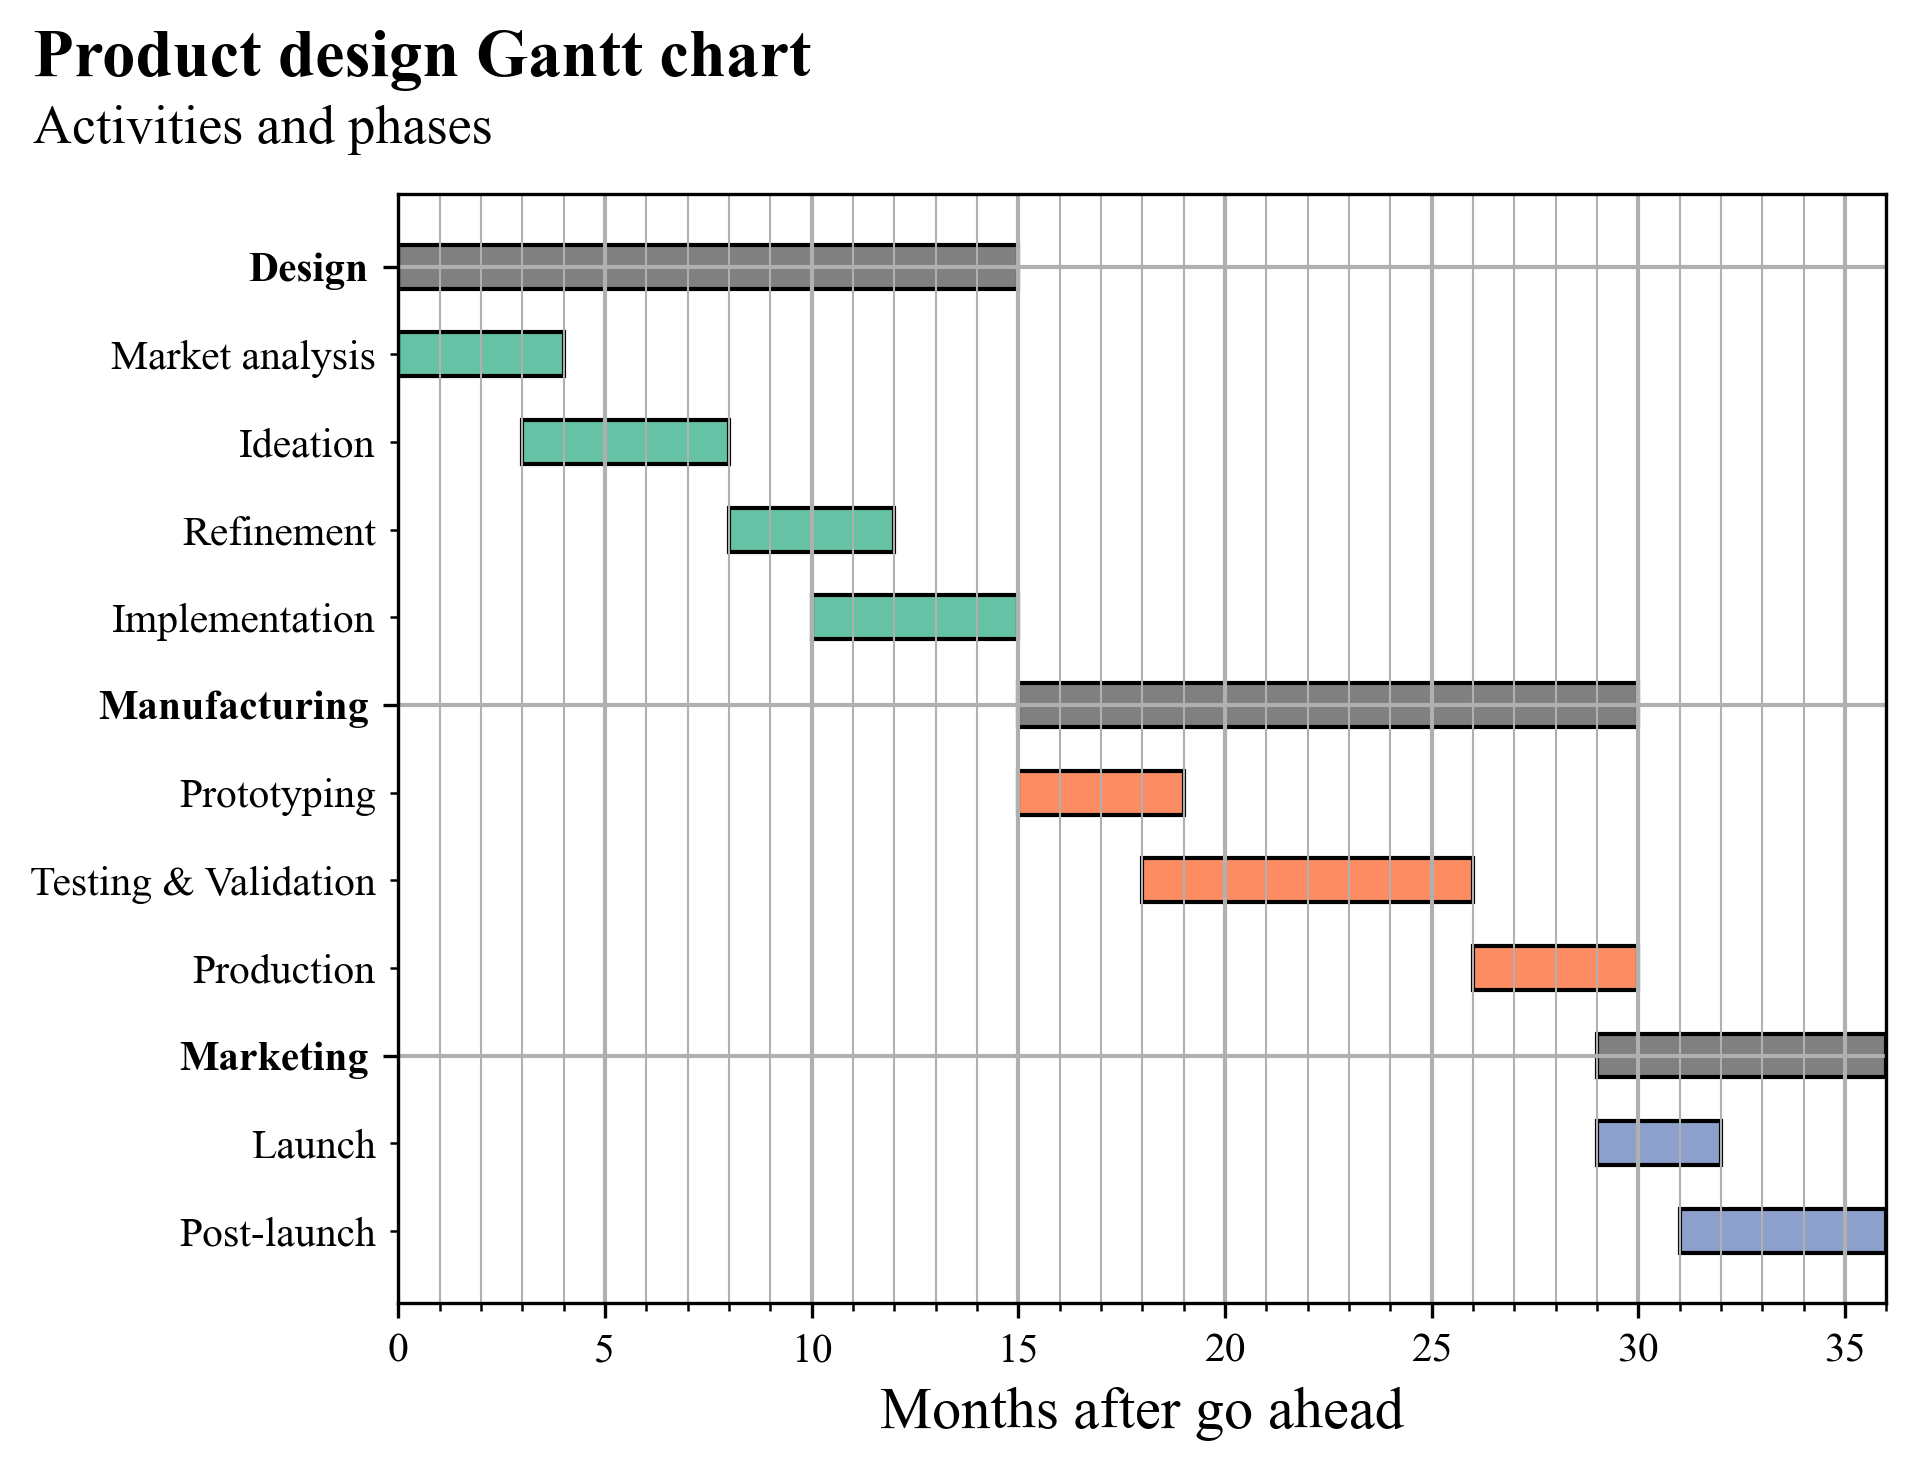
Gantt charts
| Product design (activities only) | Product design (phases & activities) |
|---|---|
 |
 |
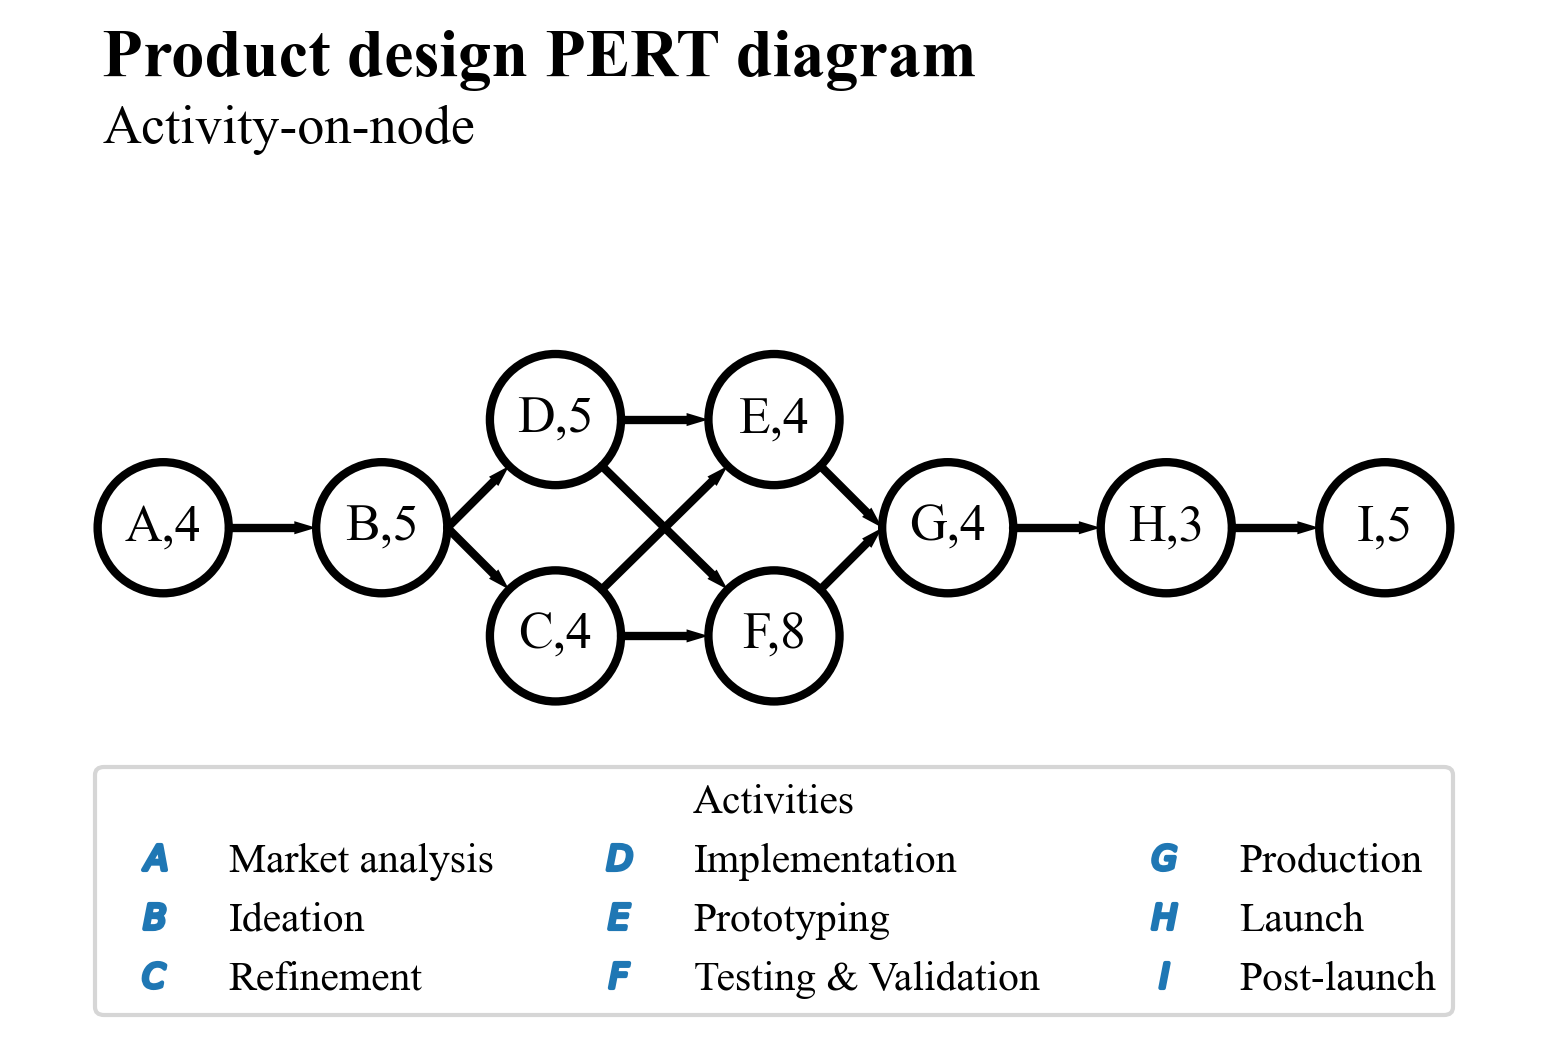
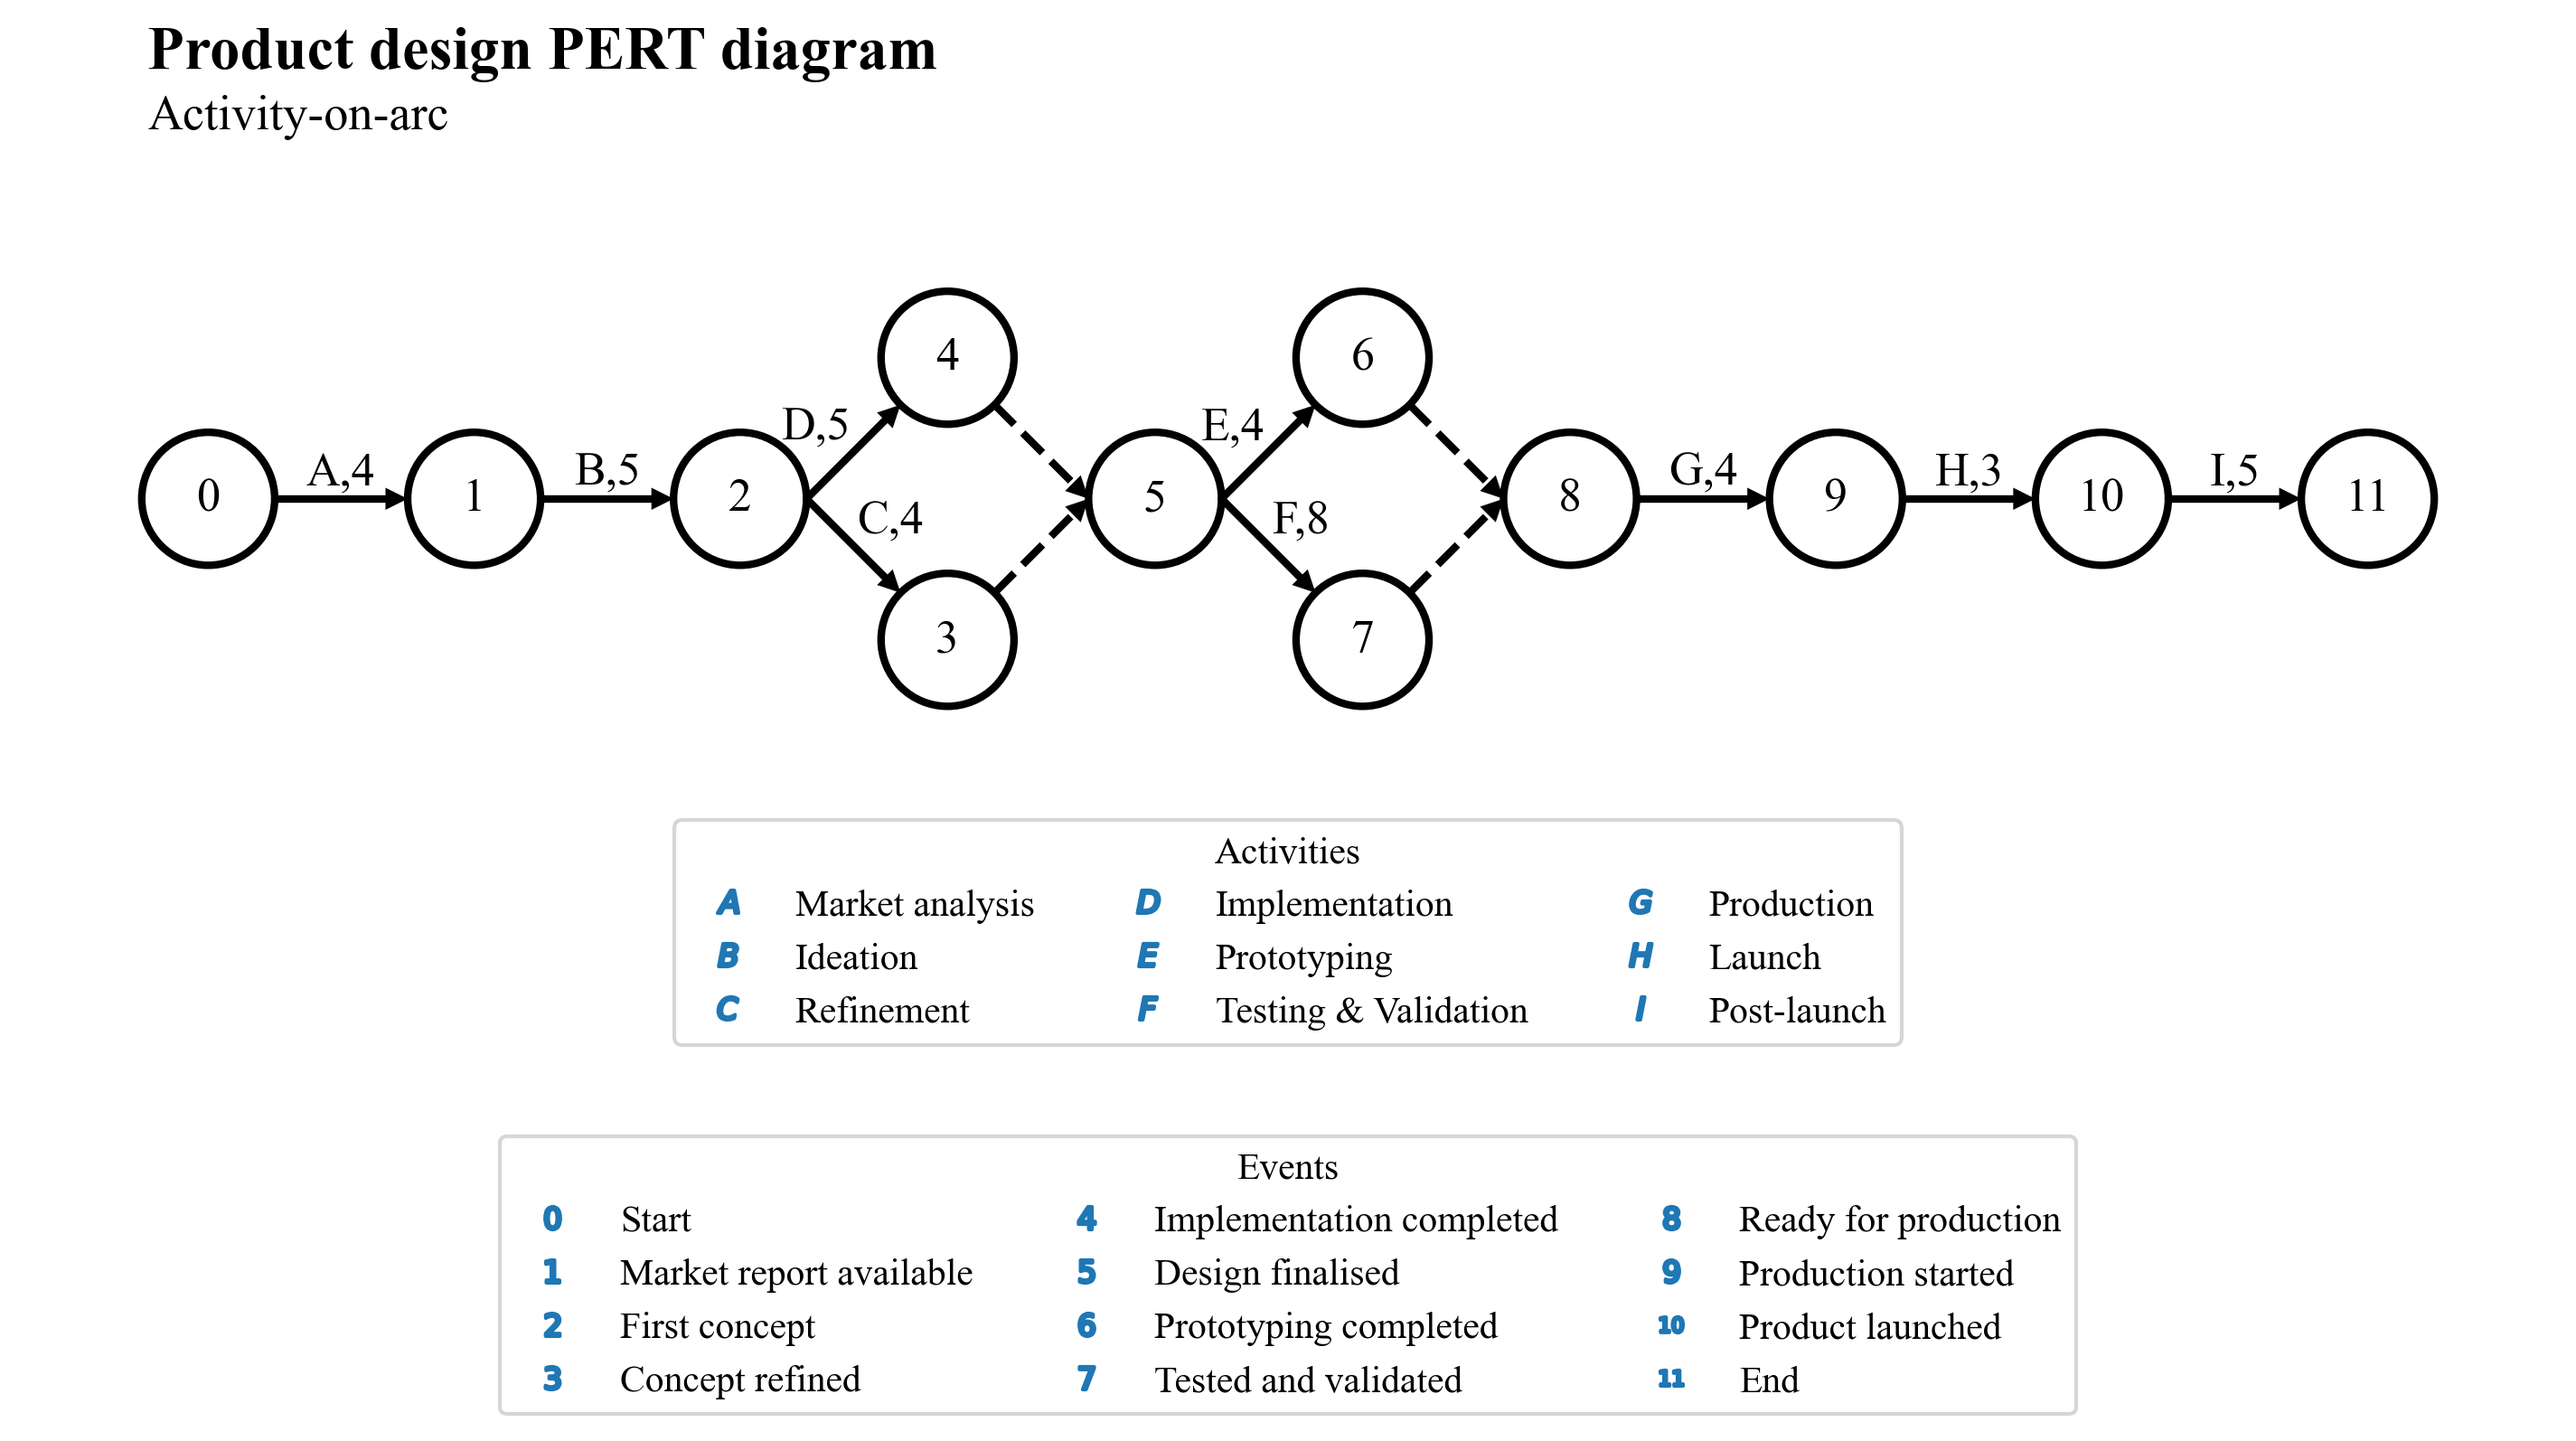
PERT diagrams
| Activity-on-node (AoN) |
|---|
 |
| Activity-on-arc (AoA) |
|---|
 |
Licence
© Francesco Bianconi 2024, under exclusive licence to Springer Nature Switzerland AG